Private equity secondaries: Worth a second look
Well, the last days of summer are upon us! I hope everyone has enjoyed the warm weather and that your fall plans are lining up nicely.
As you recall from the last Perspective, Delayed but not denied: July markets and strategy update, we discussed various sectoral opportunities in middle market private equity—the definition of growth at a reasonable price (GARP), commercial real estate lending and private credit more broadly. After discussing that note with our CIO, Mike Kelly (the architect of our investment platform), I wanted to provide additional color on the continued persistence of the secondary opportunity for those in a position to provide liquidity to motivated sellers.
Simply put: The secondary opportunity in private equity, particularly in the middle market, continues to be worthy of allocator attention.
The most recent secondary opportunity
As a reminder, the recent potential opportunity in secondaries [MB1] first manifested itself in 2022, when not only did you have a slowdown in initial public offerings (IPOs) and mergers and acquisitions (M&A) activity (less liquidity provided to long term PE investors), but also a painful denominator effect when both equities and bonds were simultaneously annihilated as the Fed embarked on a relentless crusade to tighten monetary policy. The Fed tightened both by jacking up the Fed funds rate and by actually shrinking money supply at the fastest rate since the Great Depression in order to respond to “non-transitory” inflation.
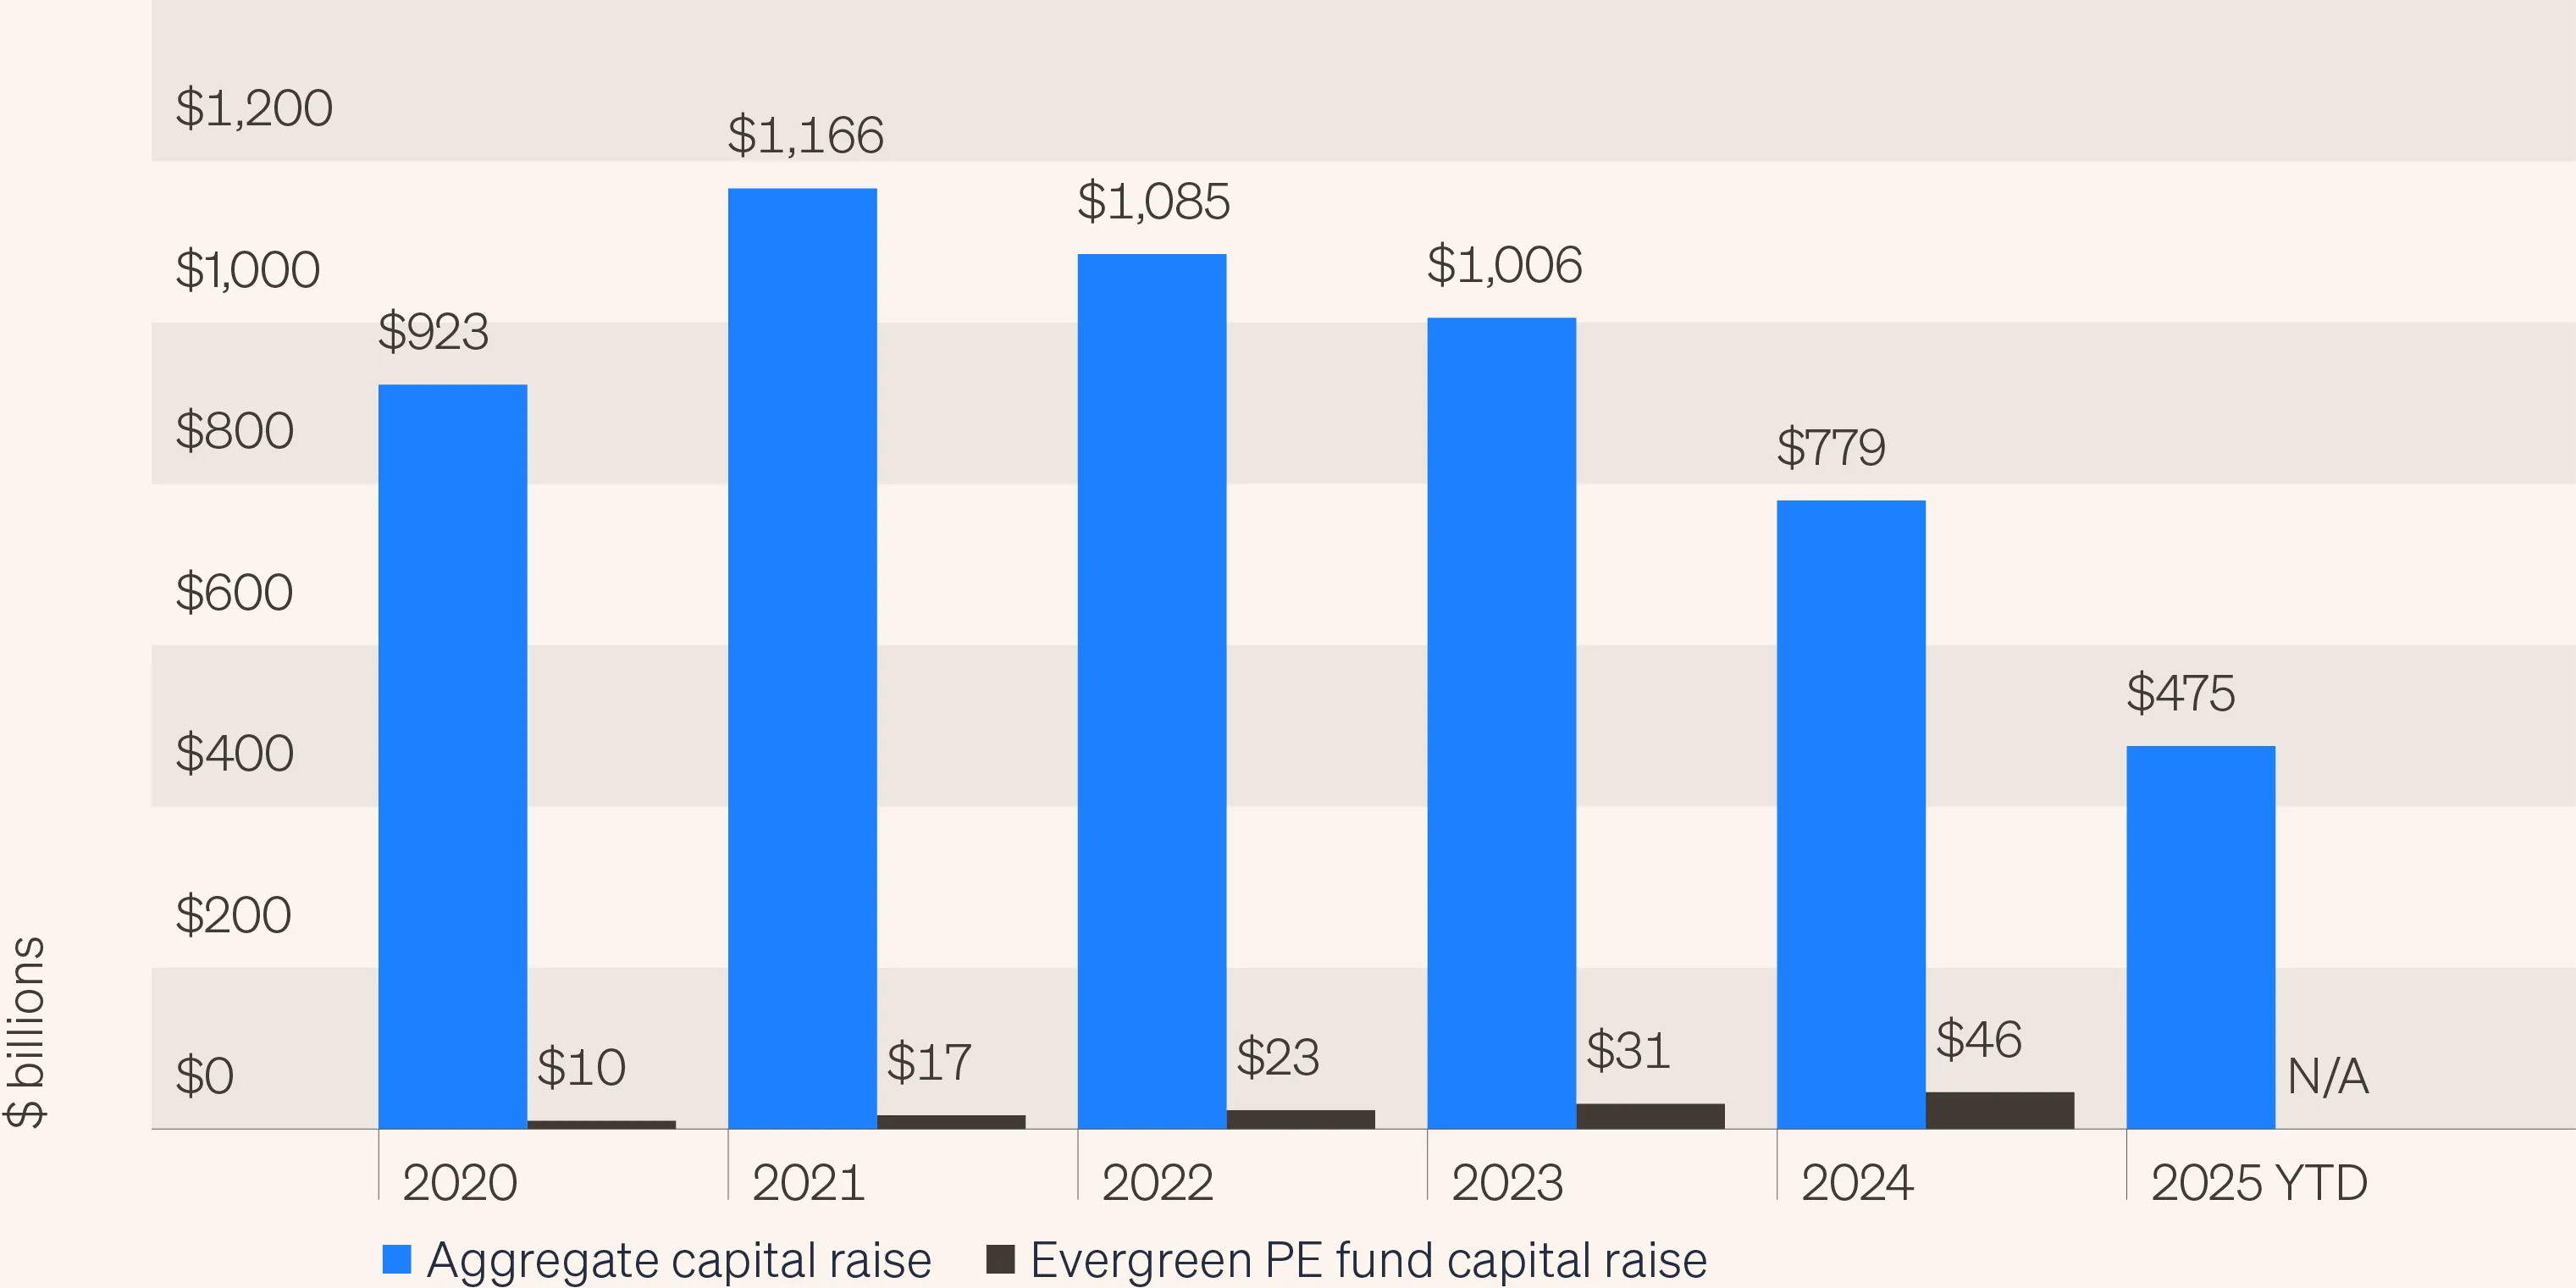
The problem was compounded by the sheer size of recent allocations from institutions. As shown in the chart below (“Vast majority of PE AUM invested by institutions and mega QPs”), the vast majority of PE capital that was ever raised up to that point came in the five years up to and including 2022.
Vast majority of PE AUM invested by institutions and mega QPs
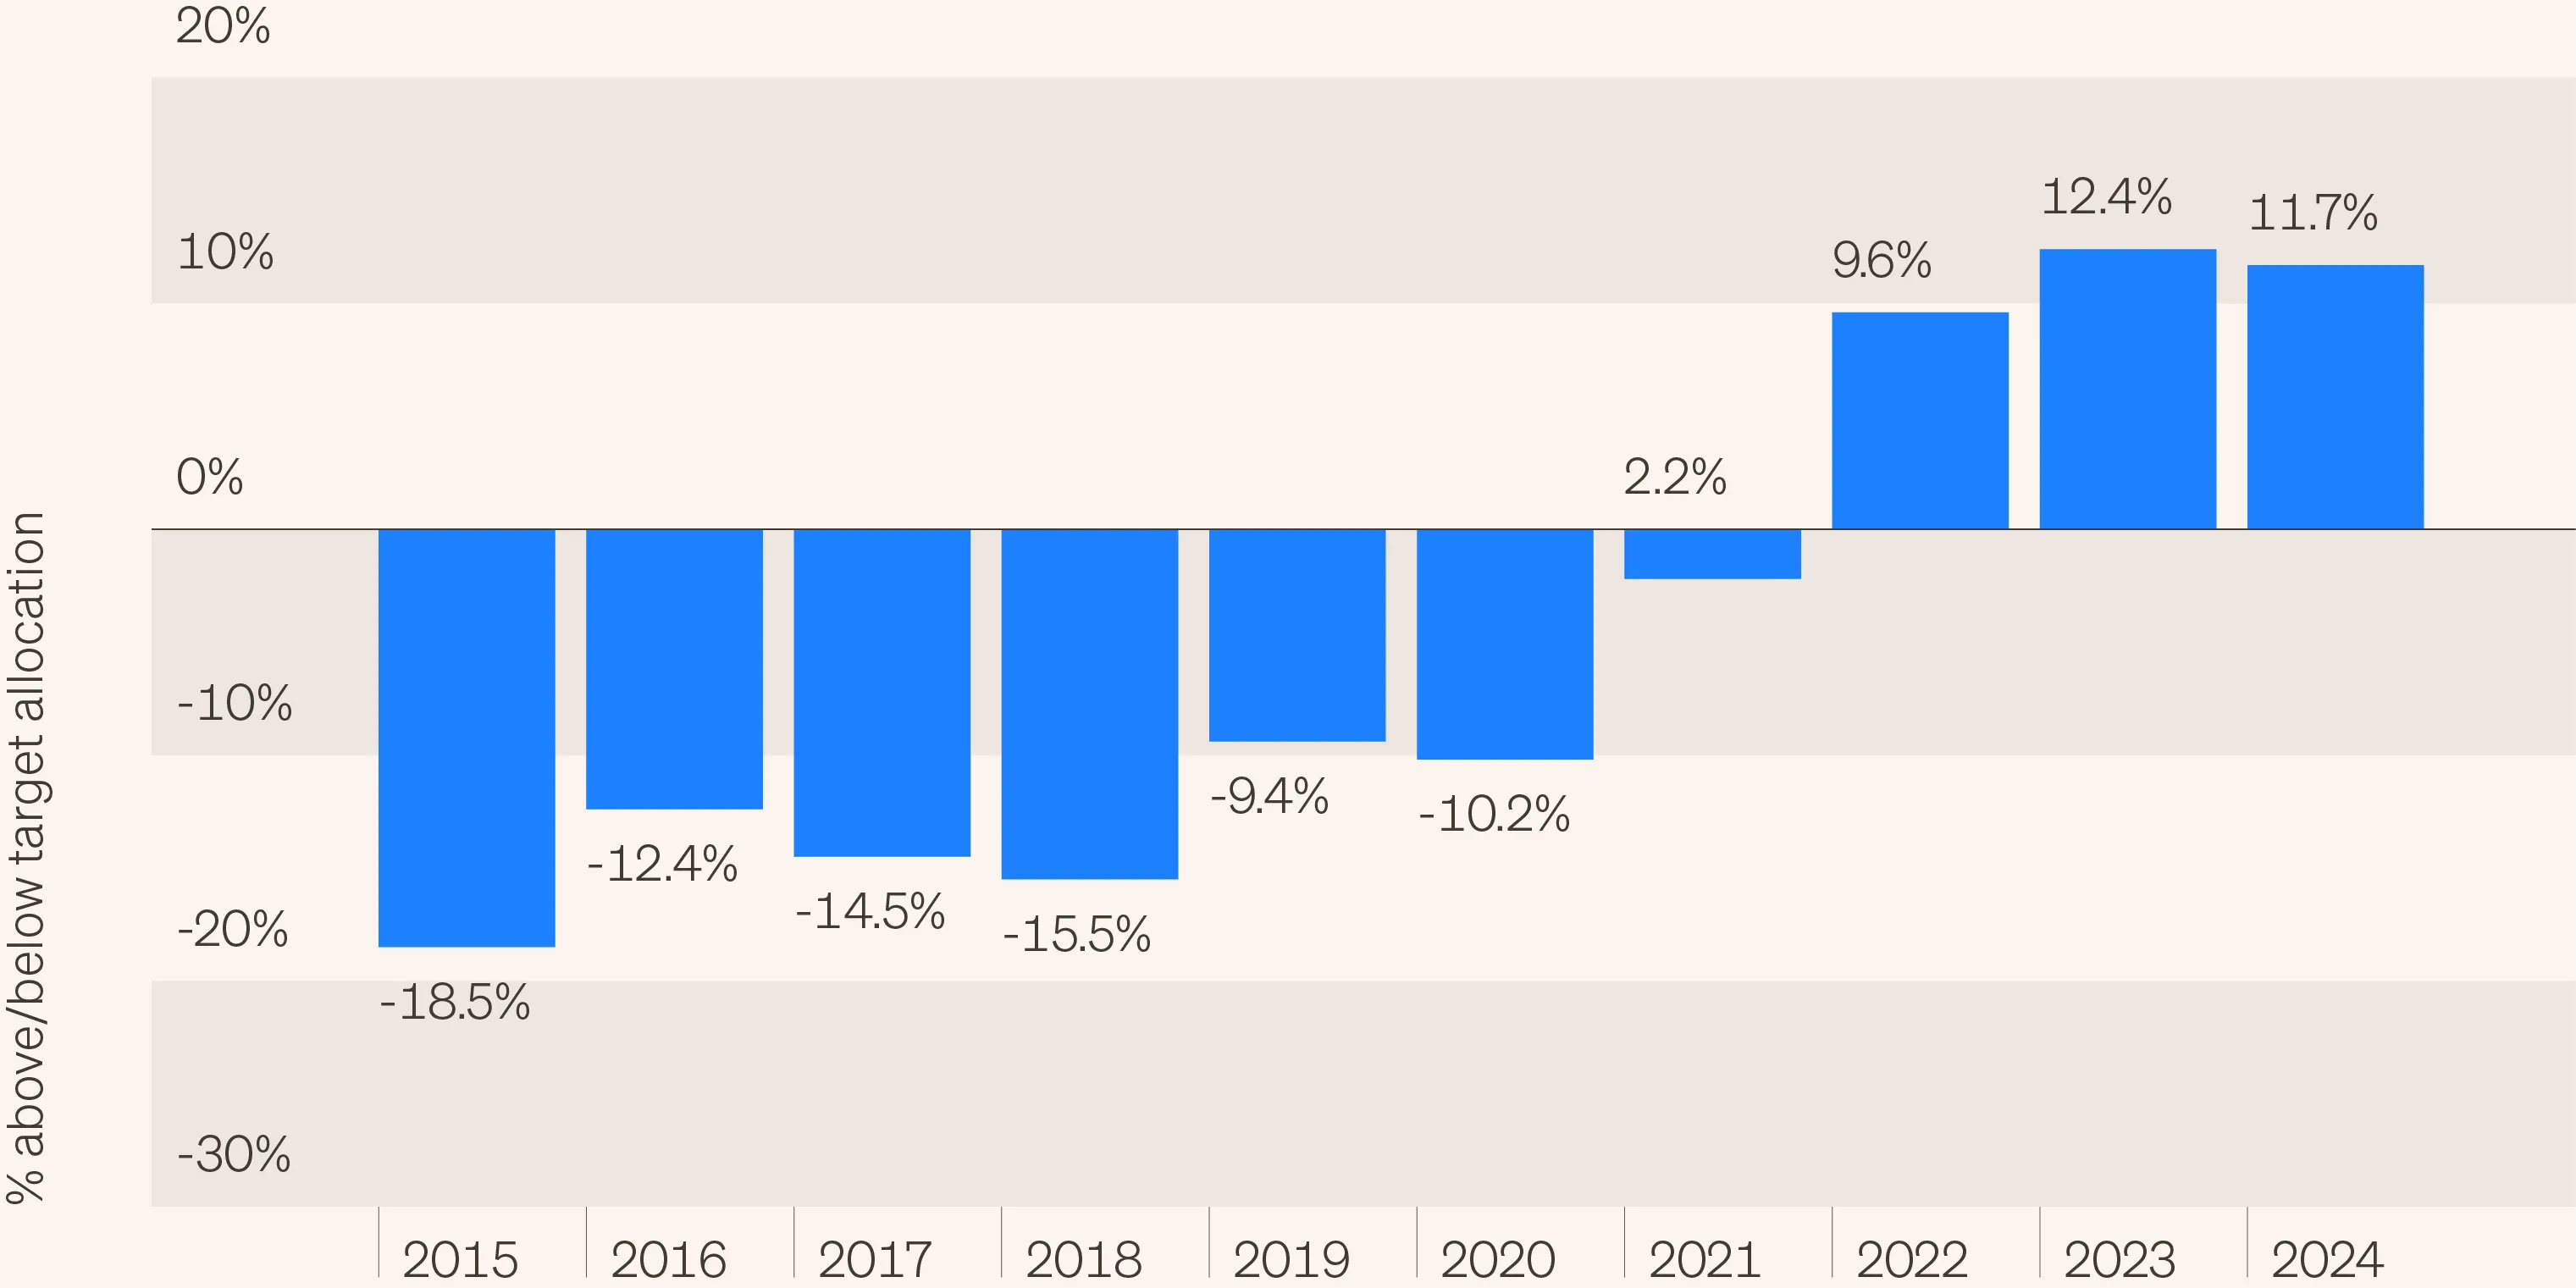
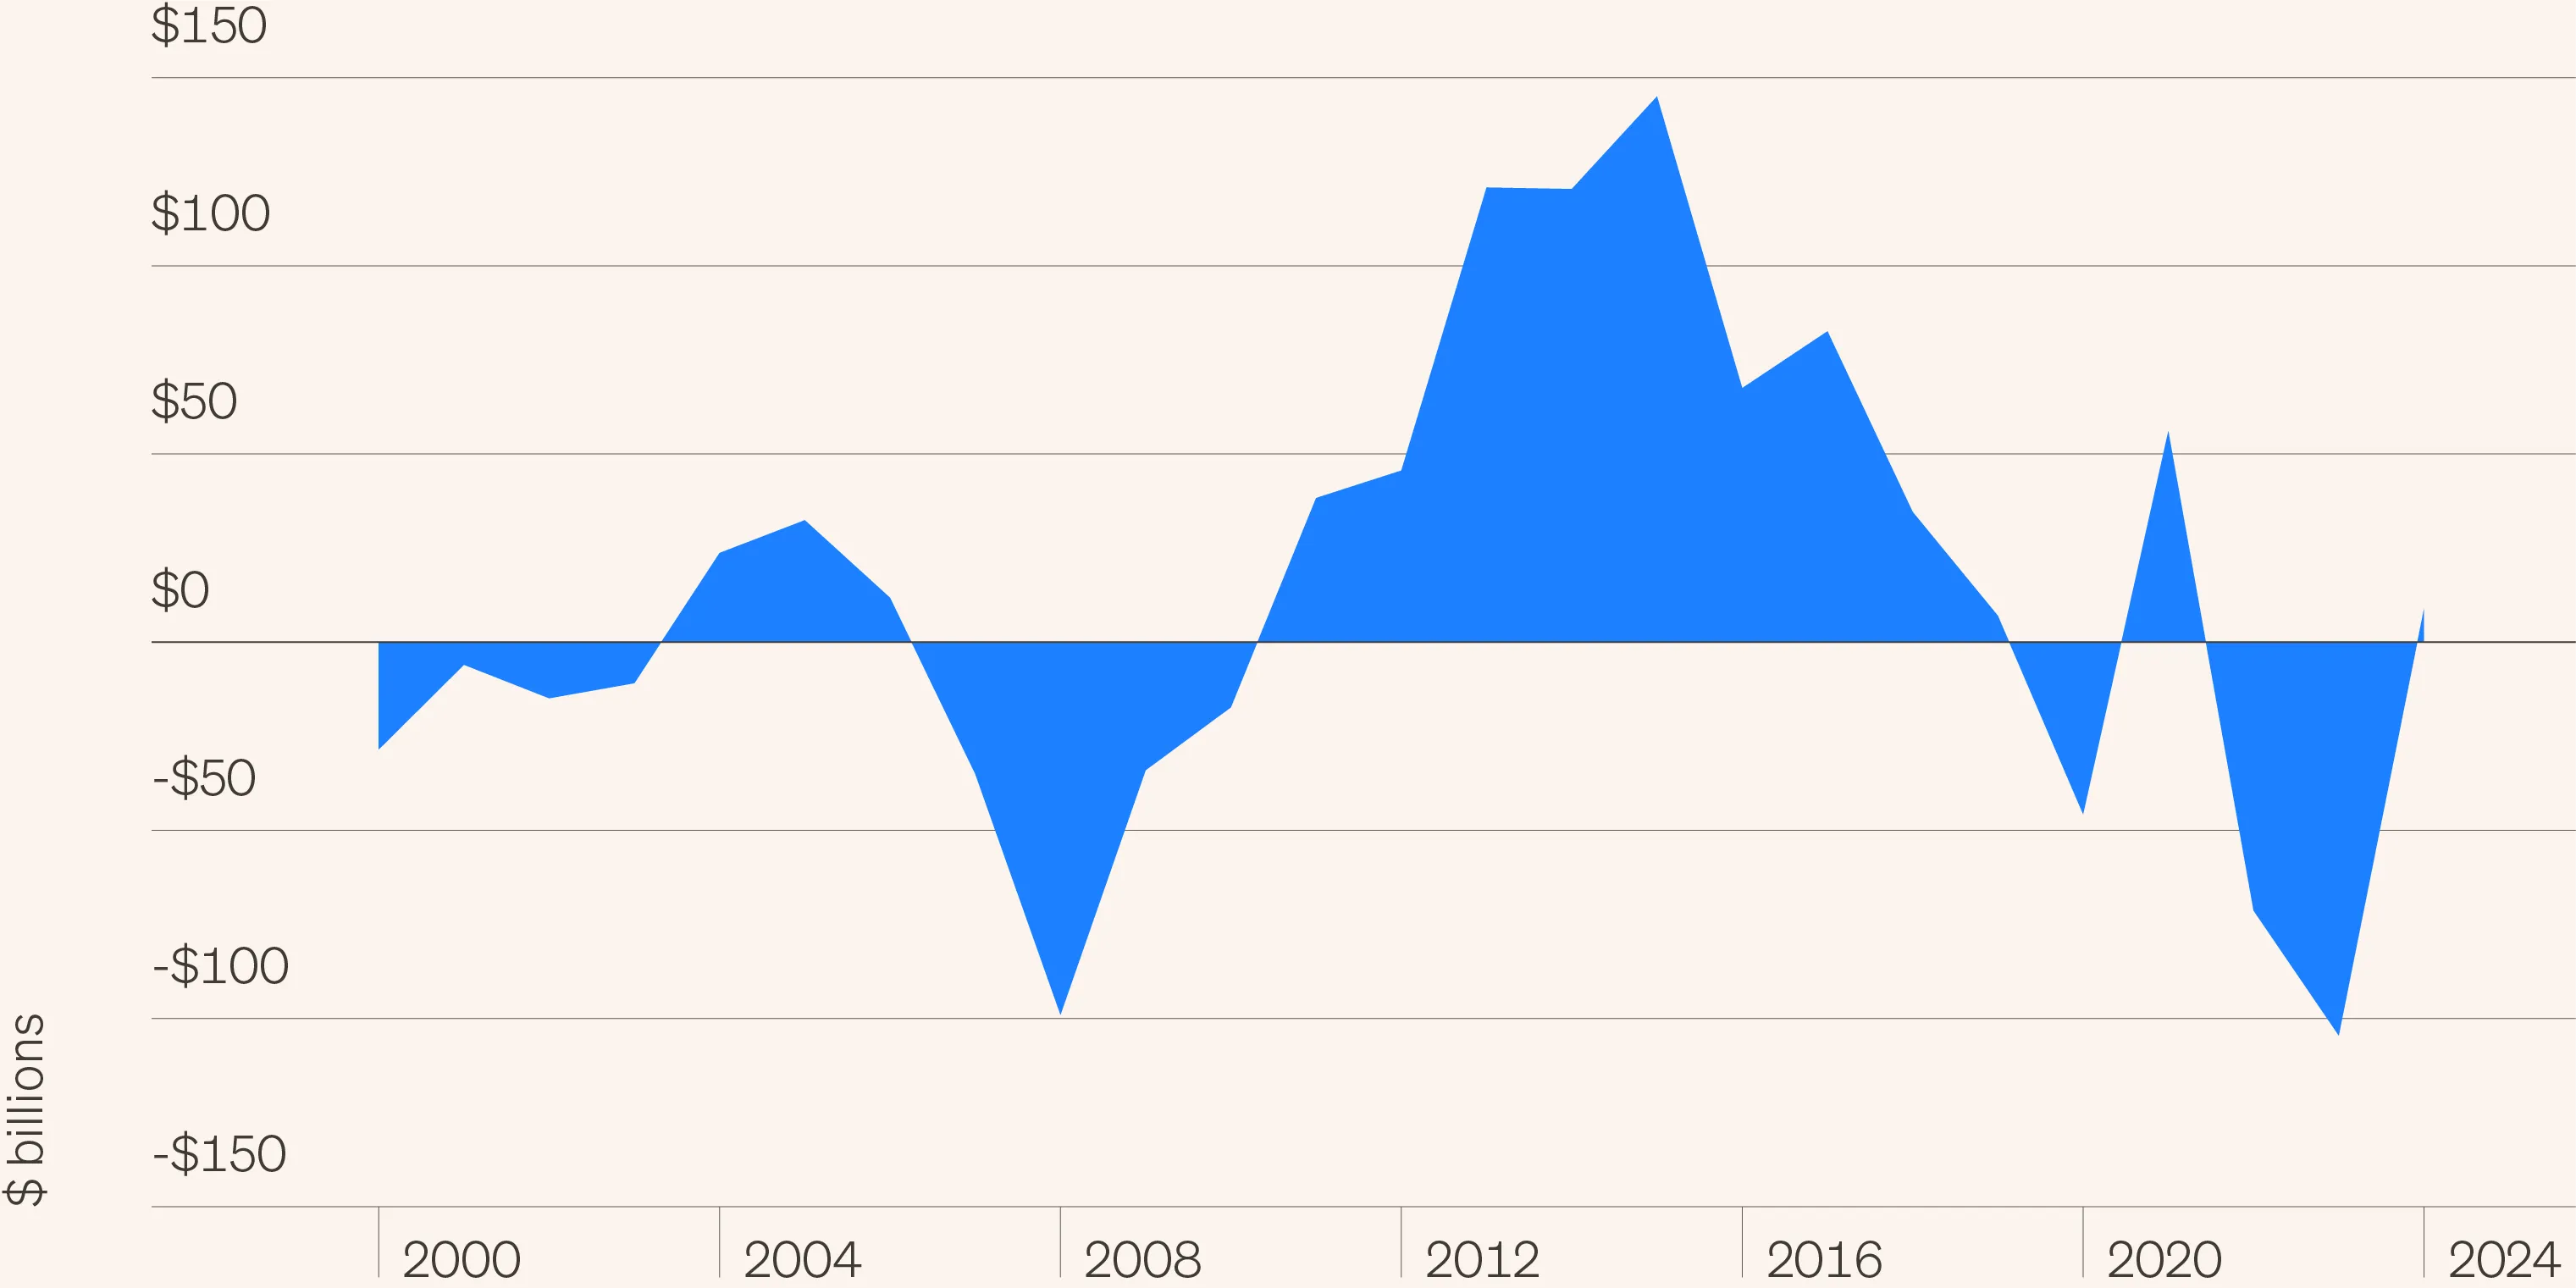
The problem was also exacerbated by the fact that institutions were overweight PE (numerator and denominator) and in some cases in negative cash flow positions as shown in the following two charts (“North American pension fund private-equity allocation” and “Limited partner net cash flows”).
North American pension fund private-equity allocation
Limited partner net cash flows
The opportunity in secondaries persists
Given both the need for liquidity and the denominator effect, 2022 provided attractive price entry points of this cycle, as is shown in the following chart (“LP portfolio pricing”). Prices have rebounded as some of the extreme selling pressures of 2022 and 2023 have abated. As we saw above, U.S. pensions are still overweight PE, but their cash flow position has fortunately improved.
LP portfolio pricing
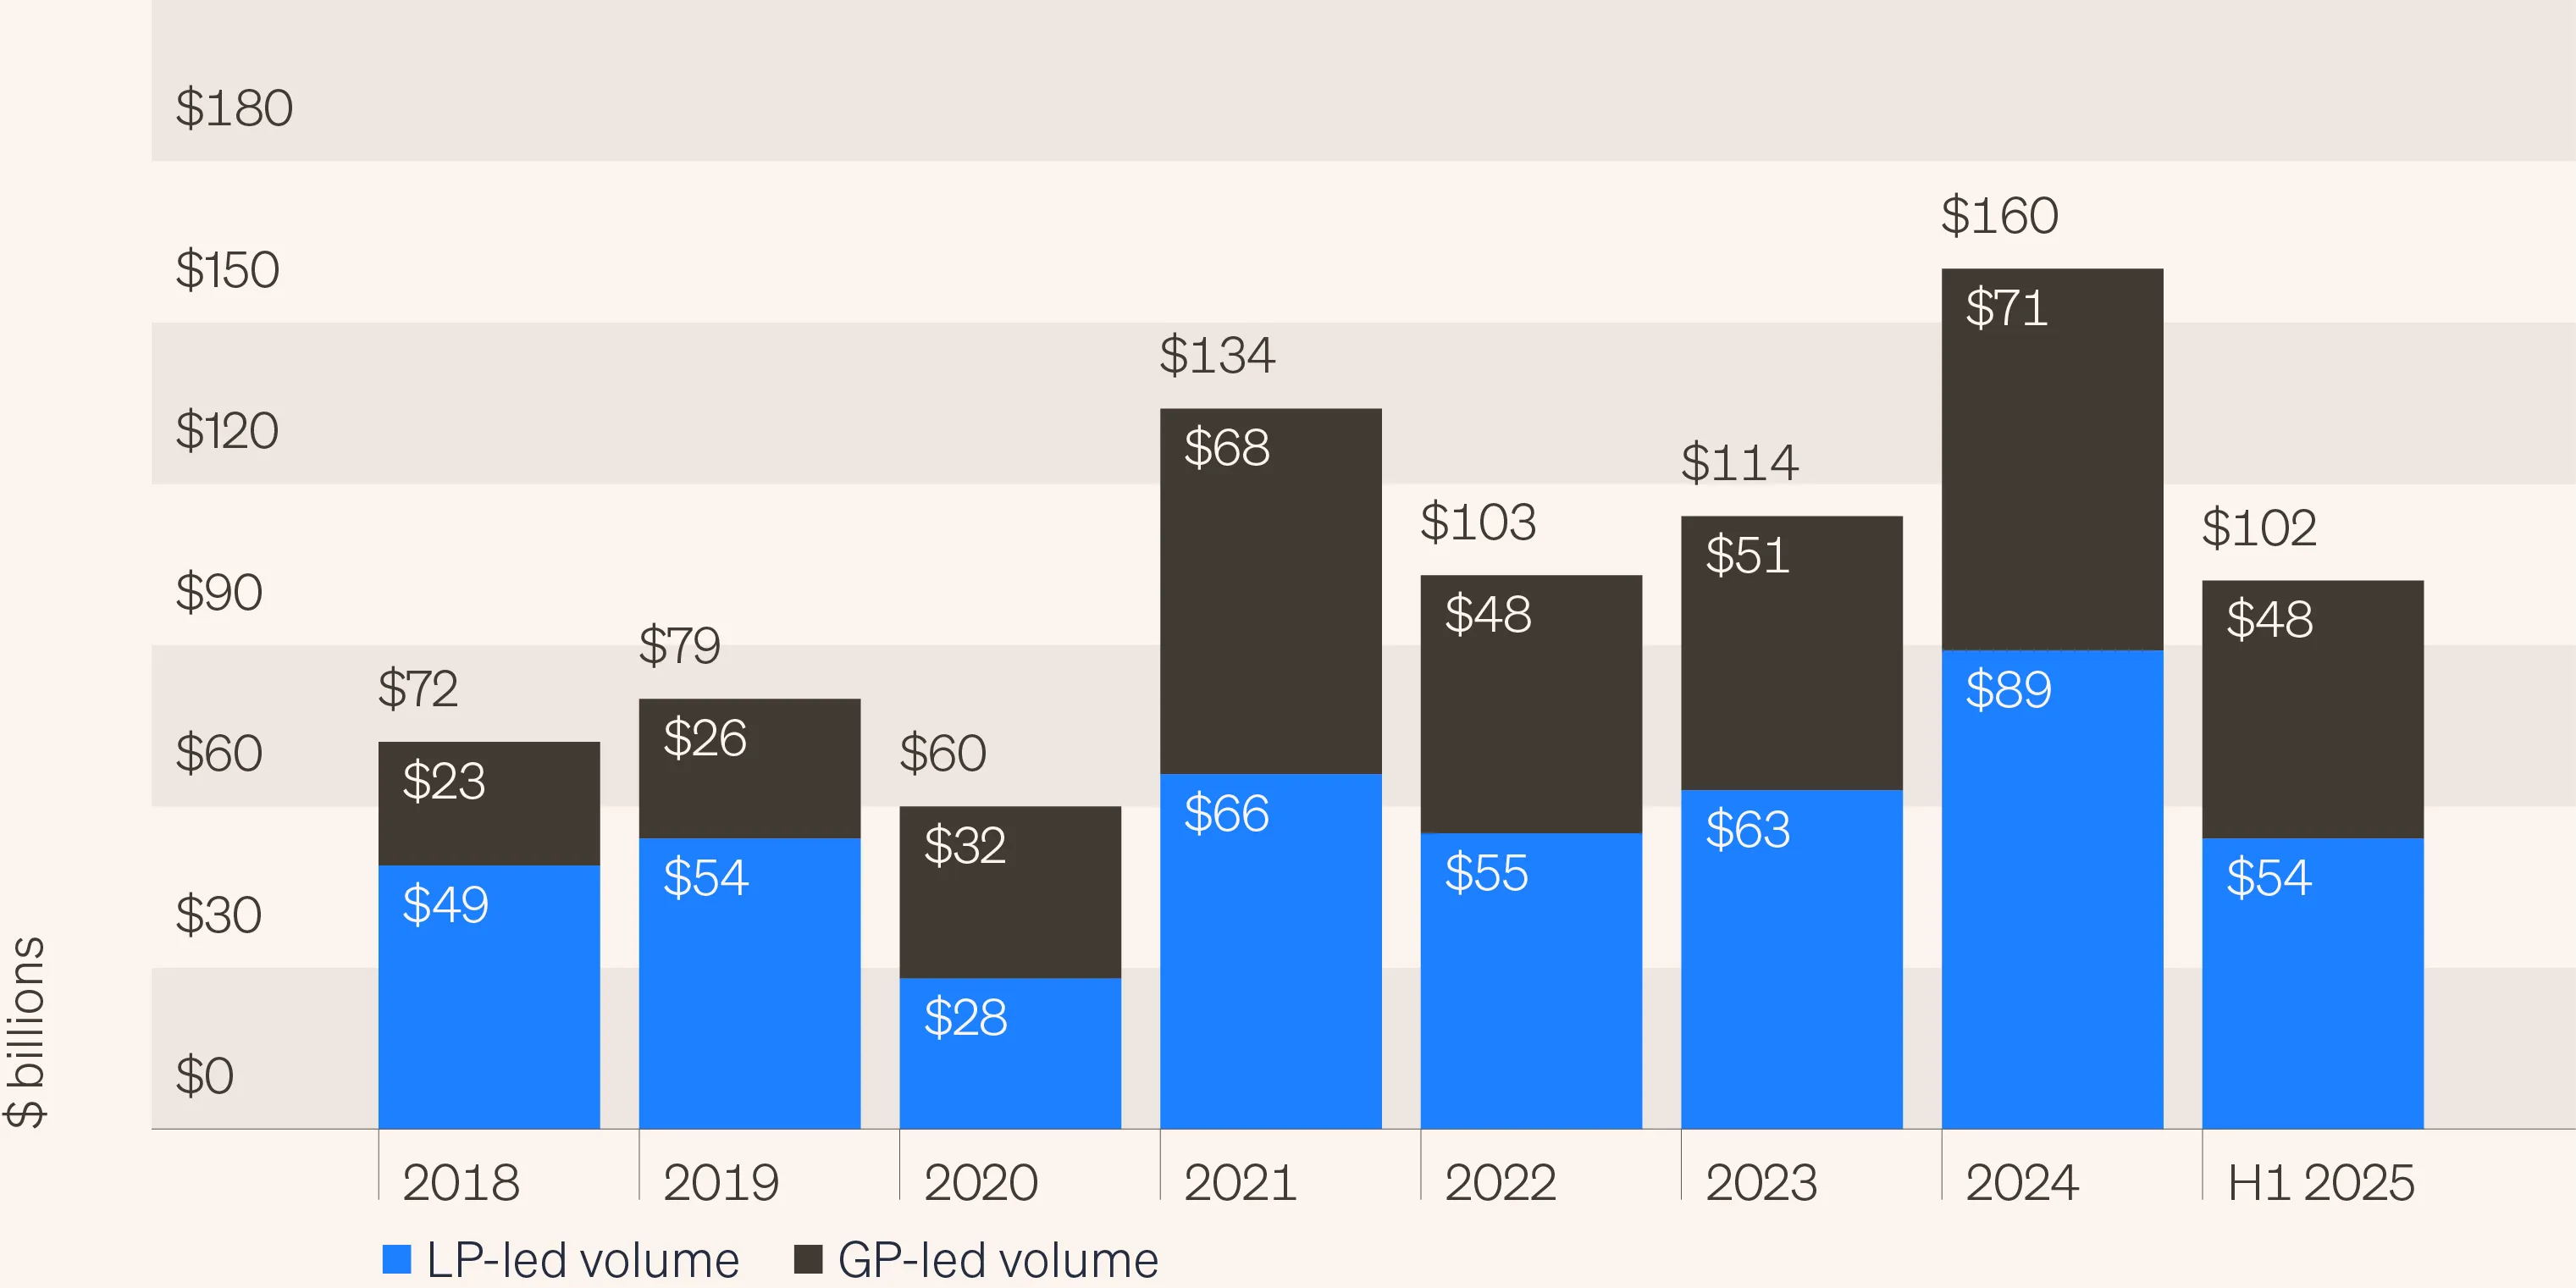
However, the opportunity in secondaries has persisted both in terms of volume (inevitably increasing) and still relatively attractive pricing (if you can source the right assets at the right price) far longer than I would have thought at the end of 2022. The fact that 2025 secondary volume is expected to be roughly double that of 2022—albeit at more normalized pricing—says it all, as we can see in the chart below (“Secondary market volume”).
Secondary market volume
So let’s explore the continued drivers of the opportunity now.
Today’s opportunity in secondaries
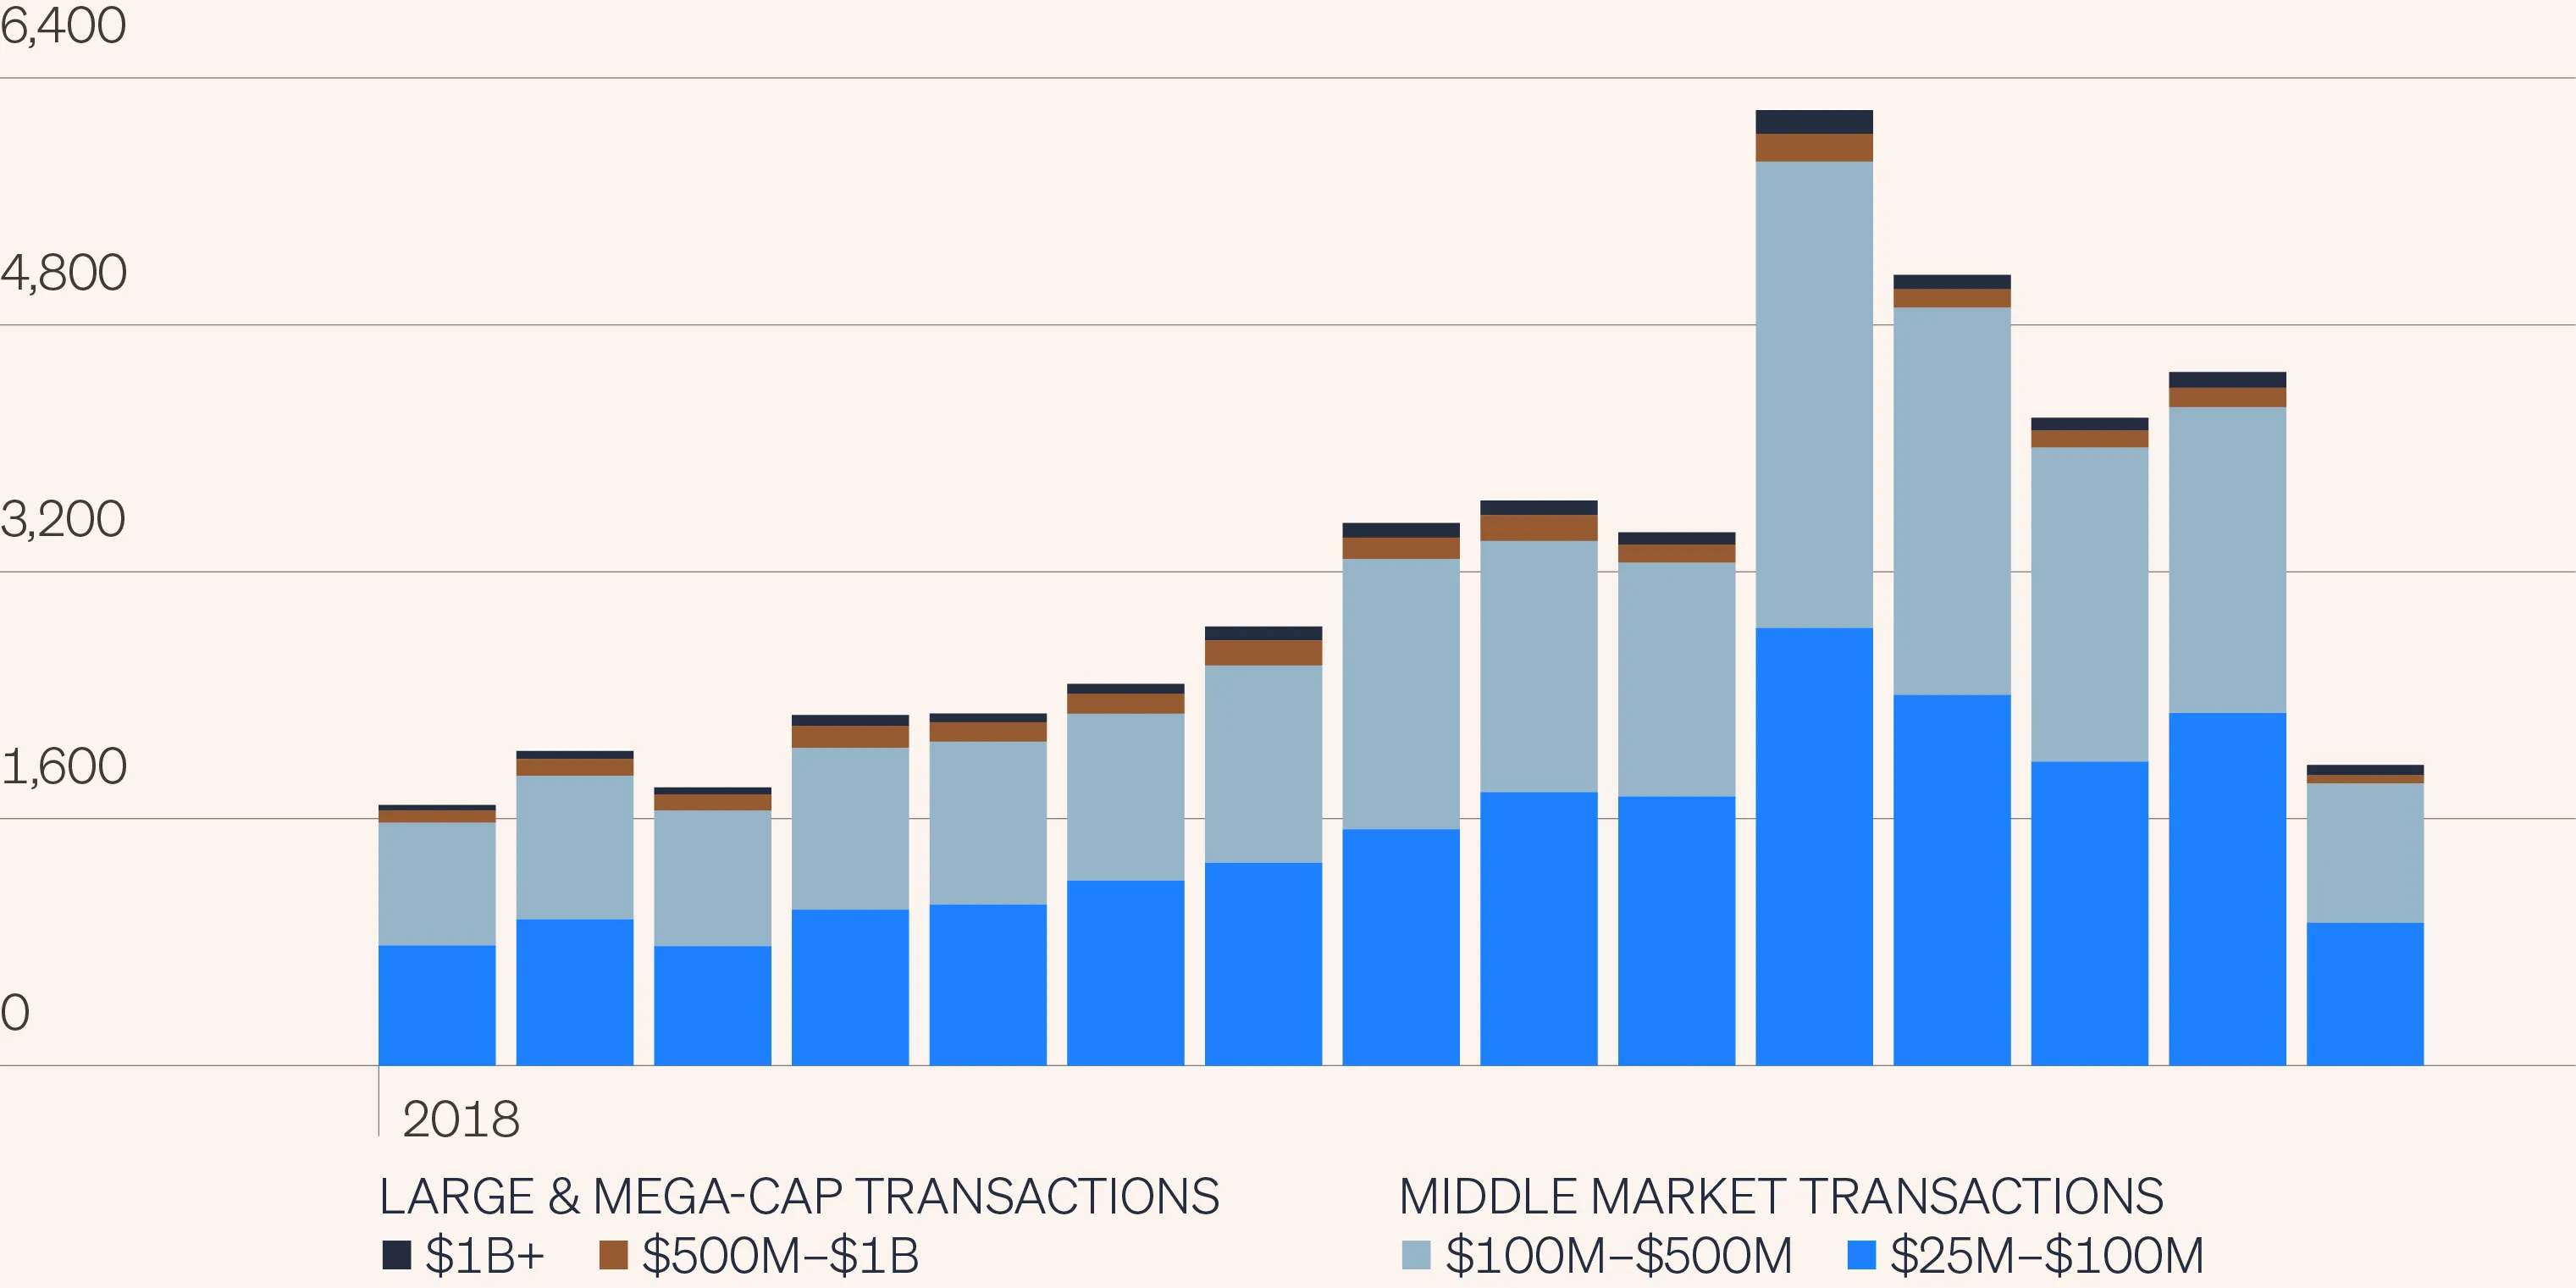
The first phenomenon that has driven the need for liquidity is the well-publicized slowdown in IPO and M&A volume since a recent peak in 2021. This can be analyzed a variety of ways, but the following chart showing PE transactions (“Steady supply of deals in U.S. middle market”) sums it up pretty well: Large and mega cap PE transactions are down considerably (about 65%) from their 2021 peak.
However, in the middle market, private equity transactions are down only 30% from their recent peak and, despite a slow Q2 courtesy of Liberation Day and the trade war, the true middle market (companies between $10 million and $1 billion of revenue) is still on track to continue to exceed pre-pandemic transaction volumes. Thus, the lack of liquidity in PE is primarily a problem for large and mega cap sponsors while there continues to be adequate transaction volume for investors focused on the middle market to enter and exit portfolio positions.
Steady supply of deals in U.S. middle market
Institutions have become concentrated in more recent PE vintages
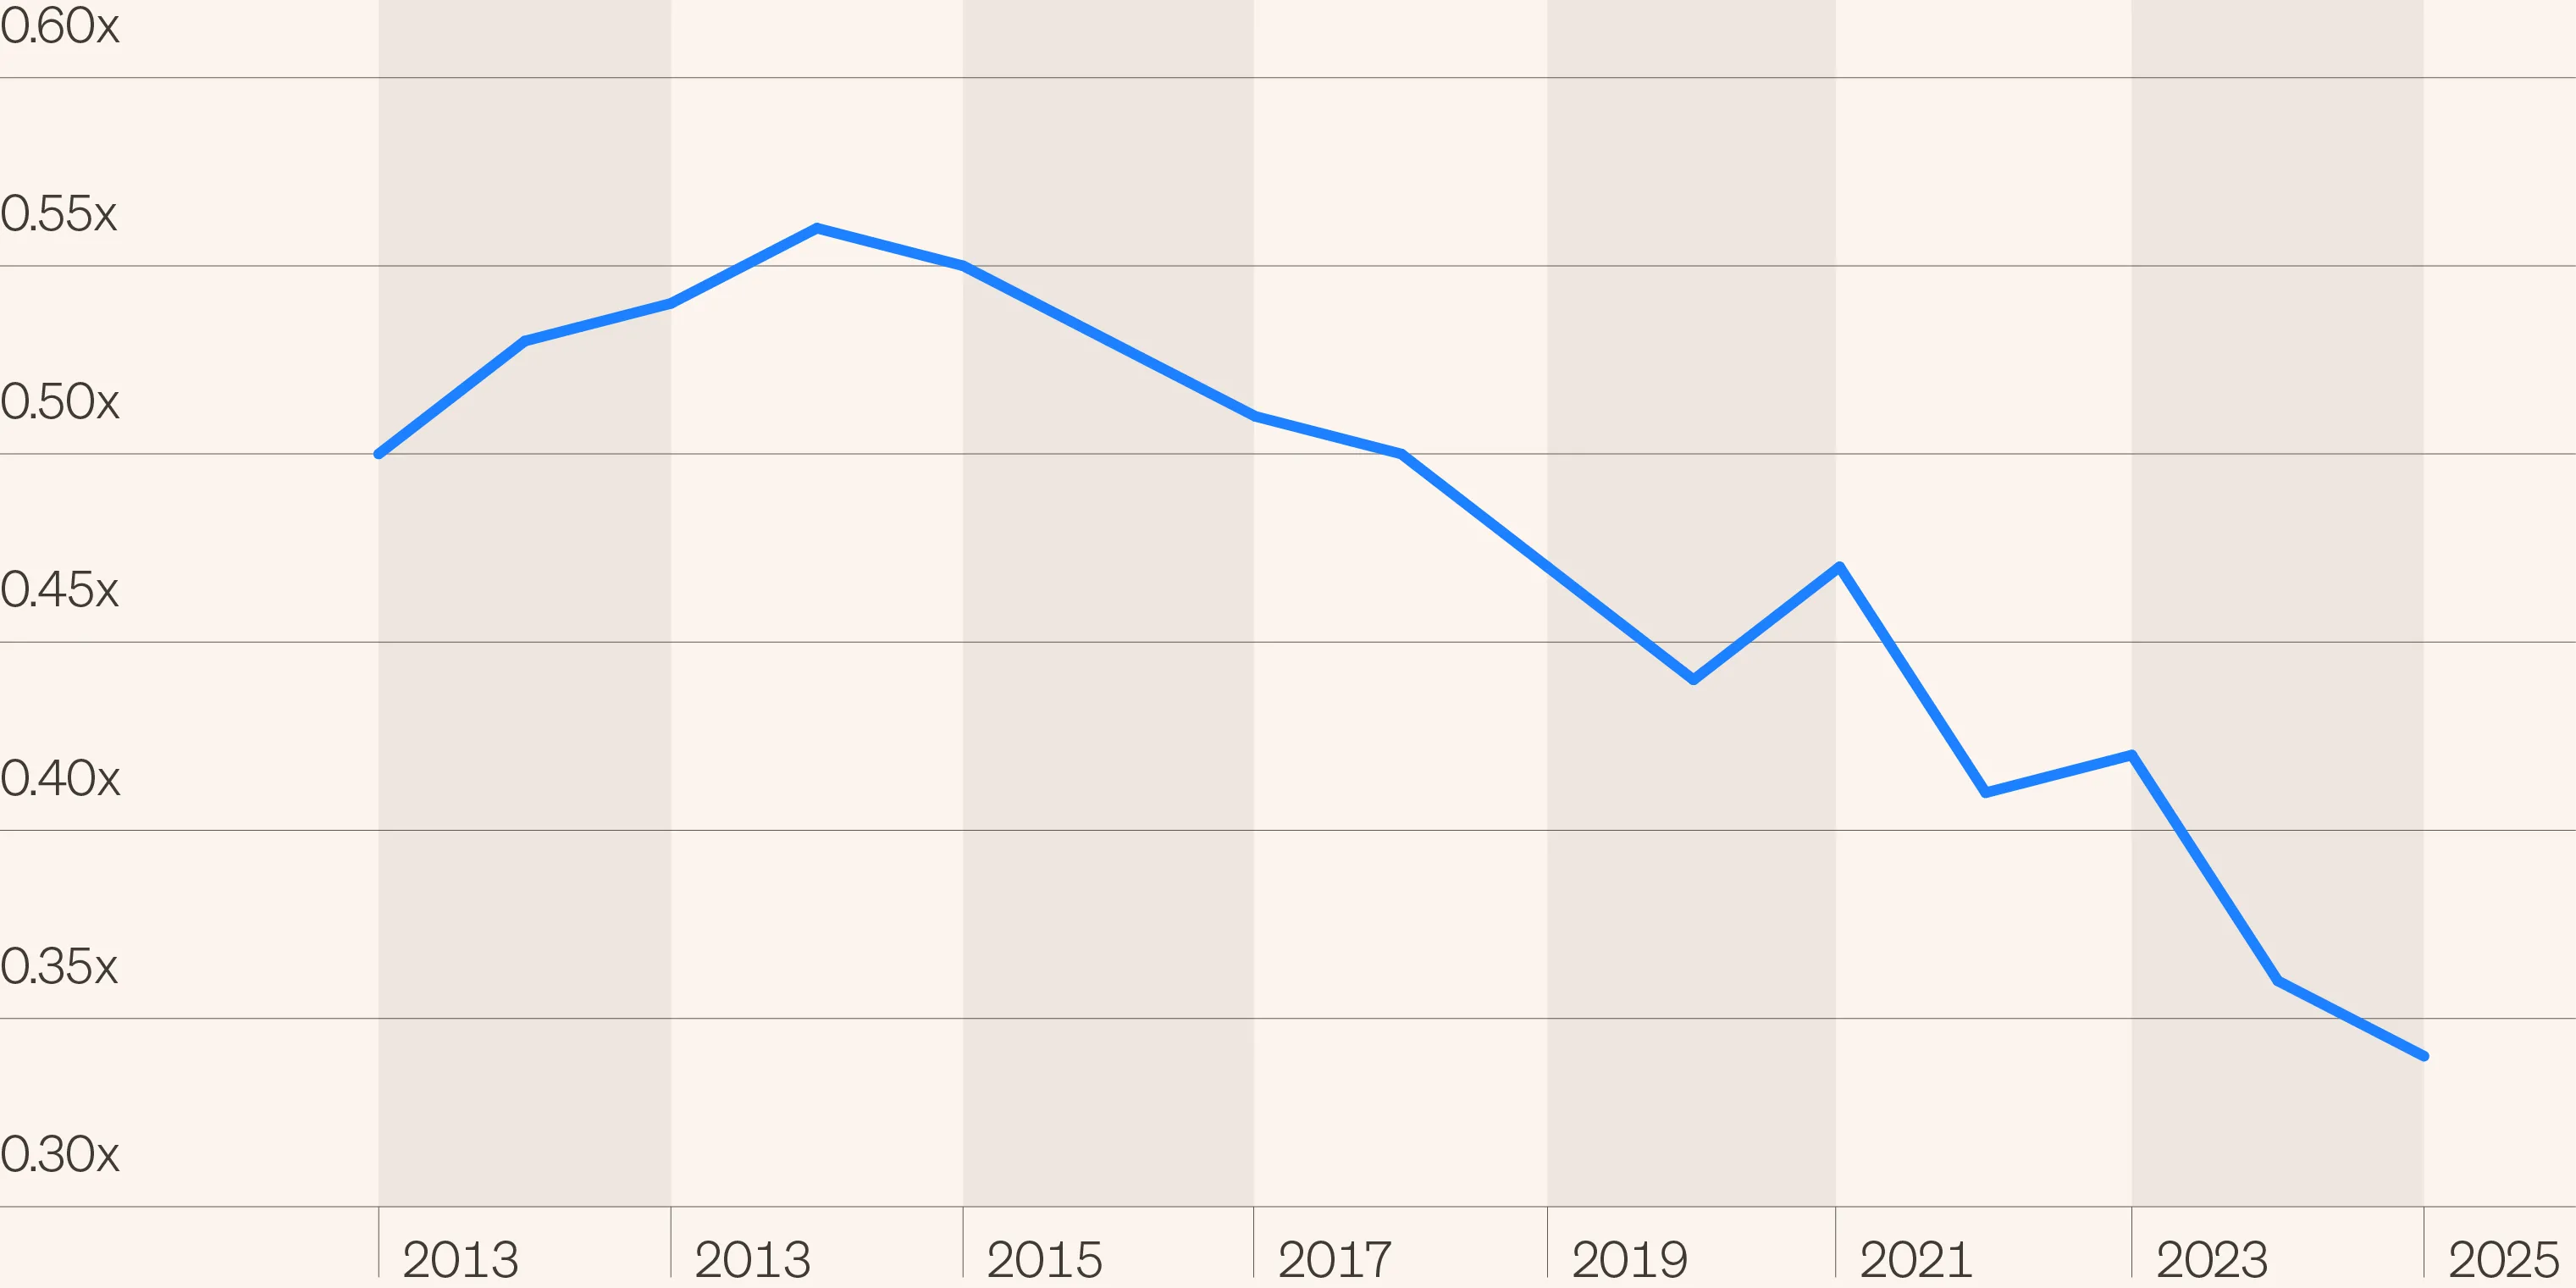
Another way of wrapping your brain around the continued drivers of record secondary volume are the following charts which show how concentrated institutions have become in more recent vintages in PE (no surprise, given the data in the first chart below, “Vintage composition in LP-led deals”) as well as the collapsing level of private equity exits vs. investments shown in the second chart below (“U.S.private equity exits-to-investments ratio”).
It doesn’t take a rocket scientist to figure out that if most of your exposure to PE is very recent vintages in a poor exit environment, then the third chart below (“Median TVPI by vintage year”) would look pretty grim for recent PE vintages.
Vintage composition in LP-led deals

U.S. private equity exits-to-investments ratio
Median TVPI by vintage year

Liquidity being provided has shifted to other PE sponsors
One of the best ways of thinking about this evolution of markets is that there isn’t a problem of liquidity (like we had in the Global Financial Crisis), it’s just that the liquidity being provided by the market to long-term institutional PE investors has shifted from the IPO market and corporate M&A, to other PE sponsors participating in private to private transactions and the secondary market, both for LP-led and GP-led (aka continuation vehicles).
Focusing on longer-term asset growth
Something to consider with respect to evergreen PE funds is that, if a fund is overly reliant on marking up the discount to drive short-term performance and not focused enough on longer-term asset growth of the secondary, future performance may be impacted negatively. If you look at the chart below (“Illustrative secondary investments based on discount and forward annualized return”), you can clearly see you are likely better off paying more (less discount) for faster growing assets than gorging on extremely cheap secondaries that have little upside after the discount markup.
Illustrative secondary investments based on discount and forward annualized return

For illustrative purposes only. Not indicative of future performance.
Conclusion: The secondary market opportunity persists
To summarize, fortunately, the secondary market opportunity persists.
At Future Standard, we are particularly excited about opportunities to source high quality assets at reasonable discounts in the LP secondary market, as well as to selectively participate in the GP-led/continuation vehicle market where the risk/return profile can approach that of co-investments.