- Direct lending has delivered positive long-term returns across five credit cycles, with income exceeding realized losses even during peak stress.
- As of Q2 2025, 86% percent of direct lending assets are now senior lien, supporting lower default rates than syndicated loans.
- Current BDC positioning suggests resilience to severe default spikes while maintaining attractive forward income potential.
Introduction
Credit markets have continued their run of strong performance, supported by a resilient economy in the face of higher benchmark interest rates and a bevy of policy risks. Public credit markets recovered swiftly following Liberation Day, with spreads now at levels that indicate significant optimism. Today’s narrow credit spreads suggest continued improvement in expected credit losses for high yield bonds and loans, but there are signals current spreads may represent a case of forced optimism rather than complacency. Net new issuance in public credit markets has plunged, resulting in robust technical support as demand easily outstripped new supply. While private credit retains its yield edge over public credit, increasing competition from the broadly syndicated loan (BSL) market for large sponsor-backed issuances has pressured pricing at the top end of the market.
This tight pricing belies a more uncertain economic backdrop. While we do not expect a recession in the near term, economic growth has slowed and narrowed into a small group of drivers—namely AI-related business investment and wealthy household spending. During such periods of imbalance, economic and market sensitivity to policy or exogenous shocks increases. With these risks in mind, it’s appropriate for investors to evaluate their performance expectations for private credit should an adverse scenario occur. This paper seeks to assess the historic resilience of the asset class, its evolution over time and how it’s currently positioned to face potential headwinds.
Private credit performance in dislocations
When assessing private credit’s historical performance, our analysis primarily focuses on direct lending, given the strategy accounts for most of private credit’s growth over the past decade and comprises over 60% of private credit assets under management (AUM).
Direct lending’s historical performance has been marked by its consistency. Since 2005, the earliest available data, the total return by calendar year has averaged 9.65%, with 2008 standing as the lone year of negative performance (-6.50%).
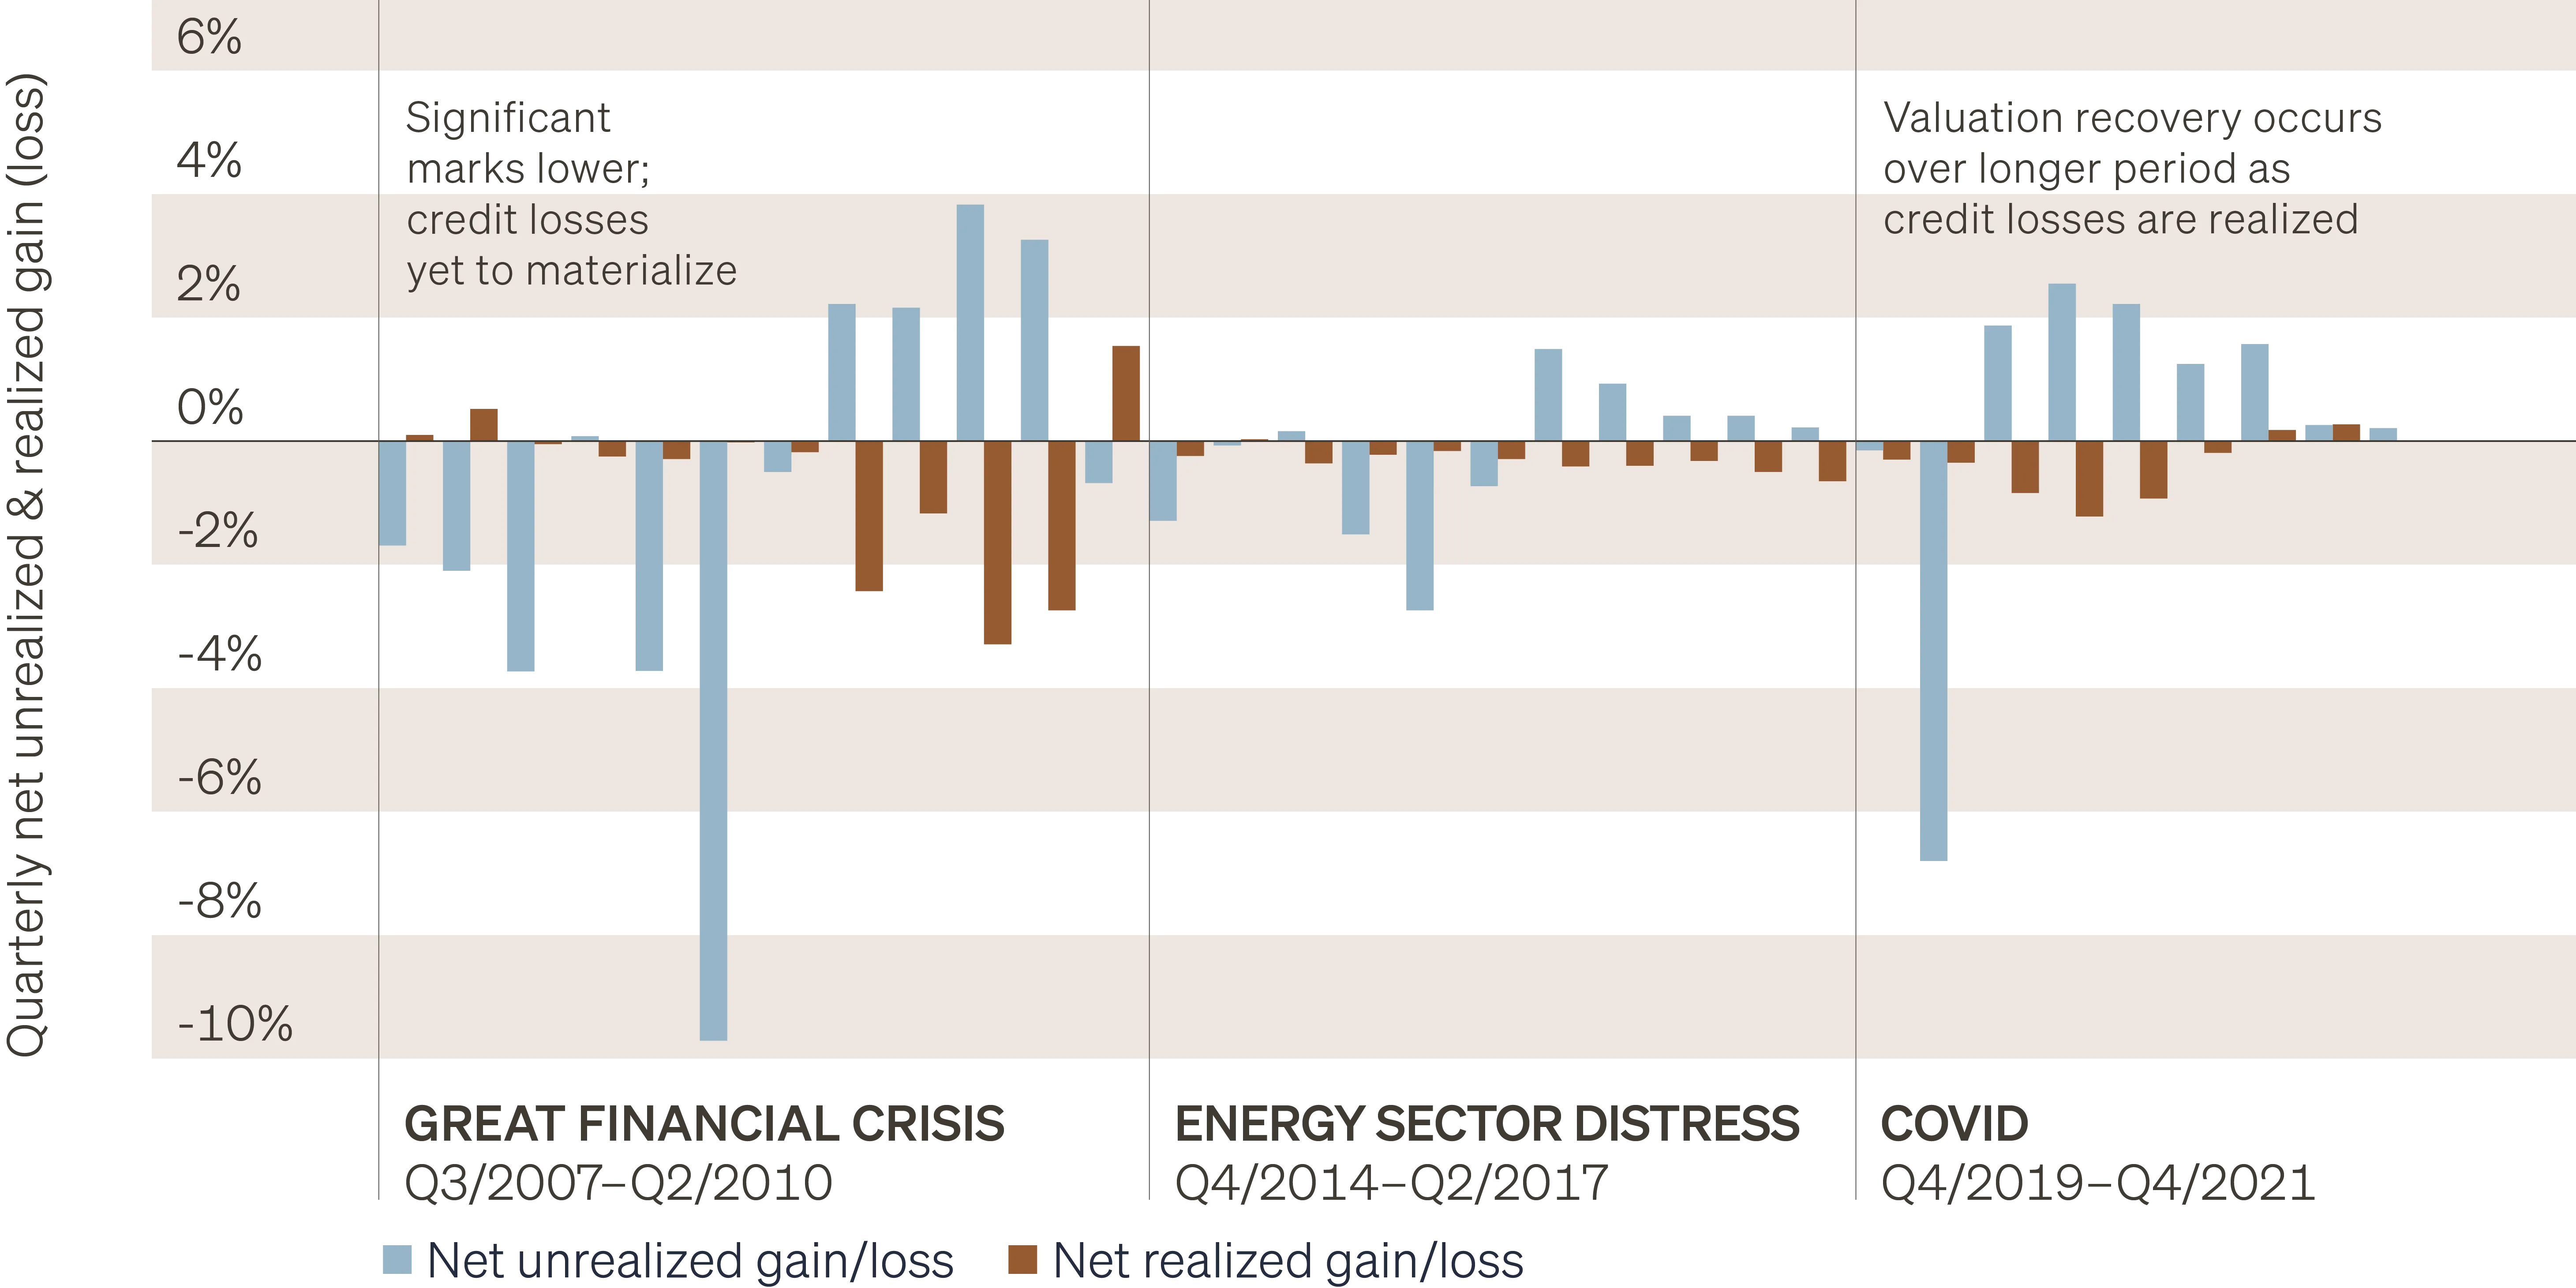
CDLI historical return attribution

In 2008, negative performance was primarily driven by lenders marking asset values lower, generating unrealized losses exceeding 16%, as lenders rightly took a grim view toward the period ahead. However, the credit losses that would ultimately be realized throughout the Global Financial Crisis (GFC) period would fall well short of lenders’ early provisioning.
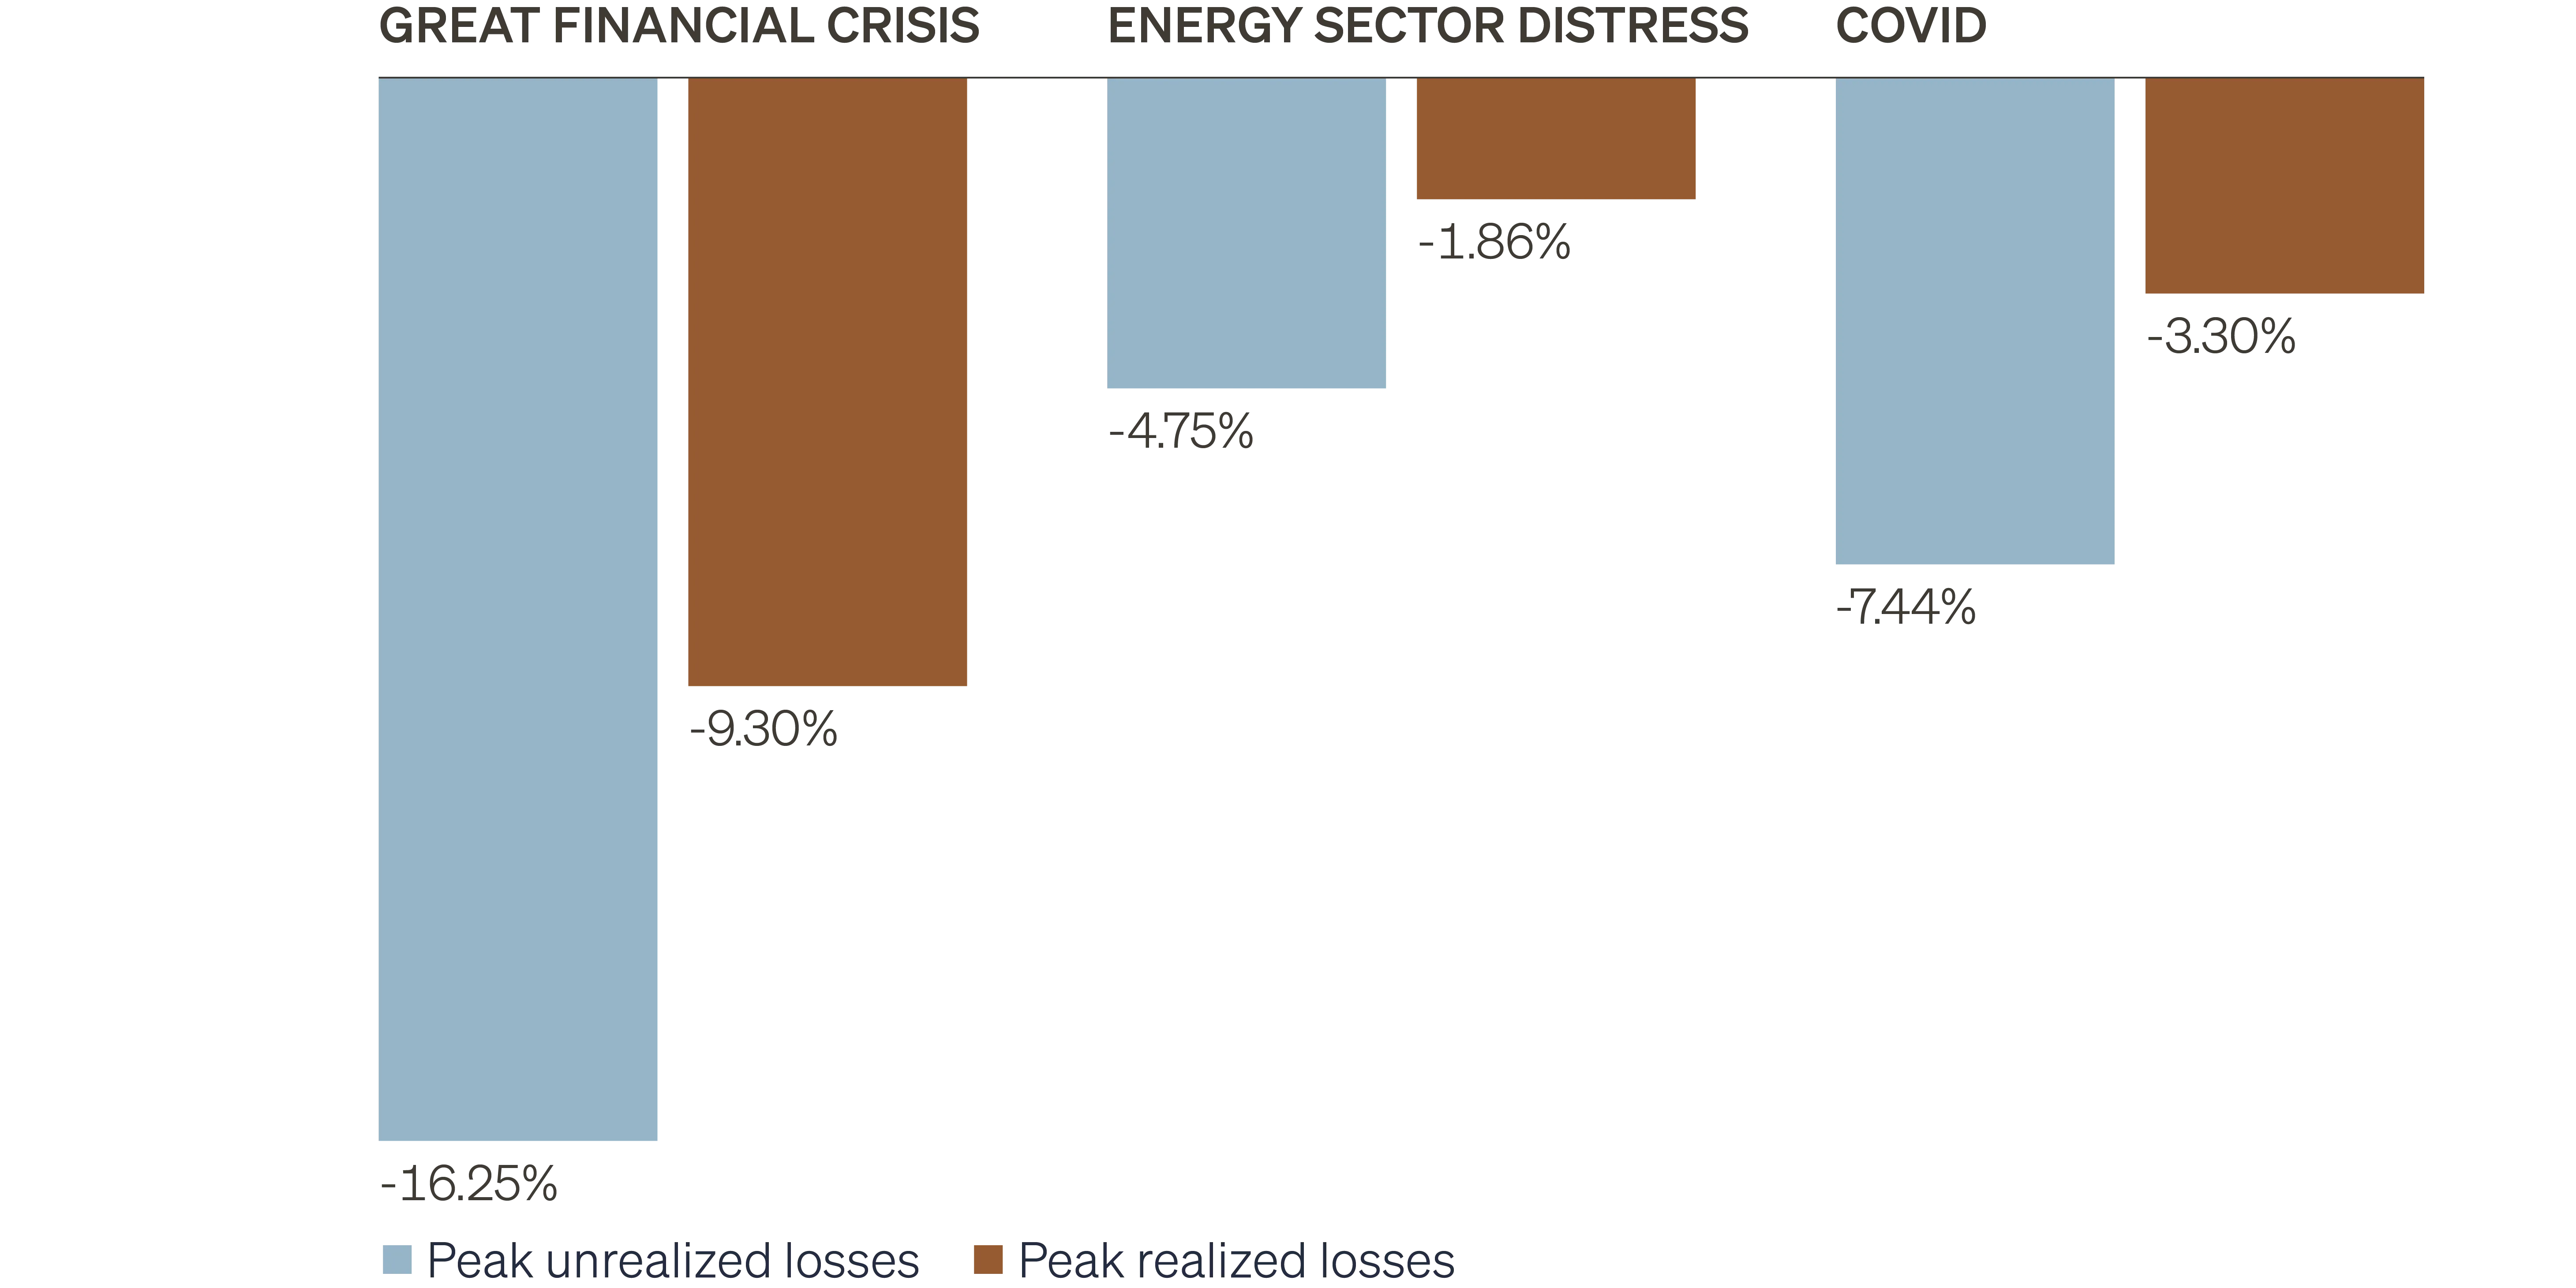
Contrary to common critiques, private direct lenders were proactive in taking lower marks during this period. As of year-end 2008, credit losses over the trailing four quarters (T4Q) were just 59bps, yet managers had already marked assets down by over 16%. Losses would ultimately peak at 9.30% at the end of Q1 2010, well below levels implied by lenders’ early marks. Because of this early caution (or fears), performance in 2009 and 2010 benefitted from a steady recovery in valuations as the default picture proved less severe than expected.
Although the sample set is limited, we observe several consistent themes across past periods of credit market stress.
- Early recognition of credit stress Lenders often mark assets down well before credit losses begin to rise.
- Delayed recovery in valuations When conditions stabilize, lenders tend to be cautious in raising valuations, waiting until losses prove to be lower than initially feared.
- Caution toward loss severity Lenders typically overestimate how severe losses will be, taking sizable markdowns up front that exceed the actual losses later realized. In each period, ultimate credit losses were roughly 50% lower than peak market expectations.
Portfolio valuation, full cycle
Direct lending losses around stress periods
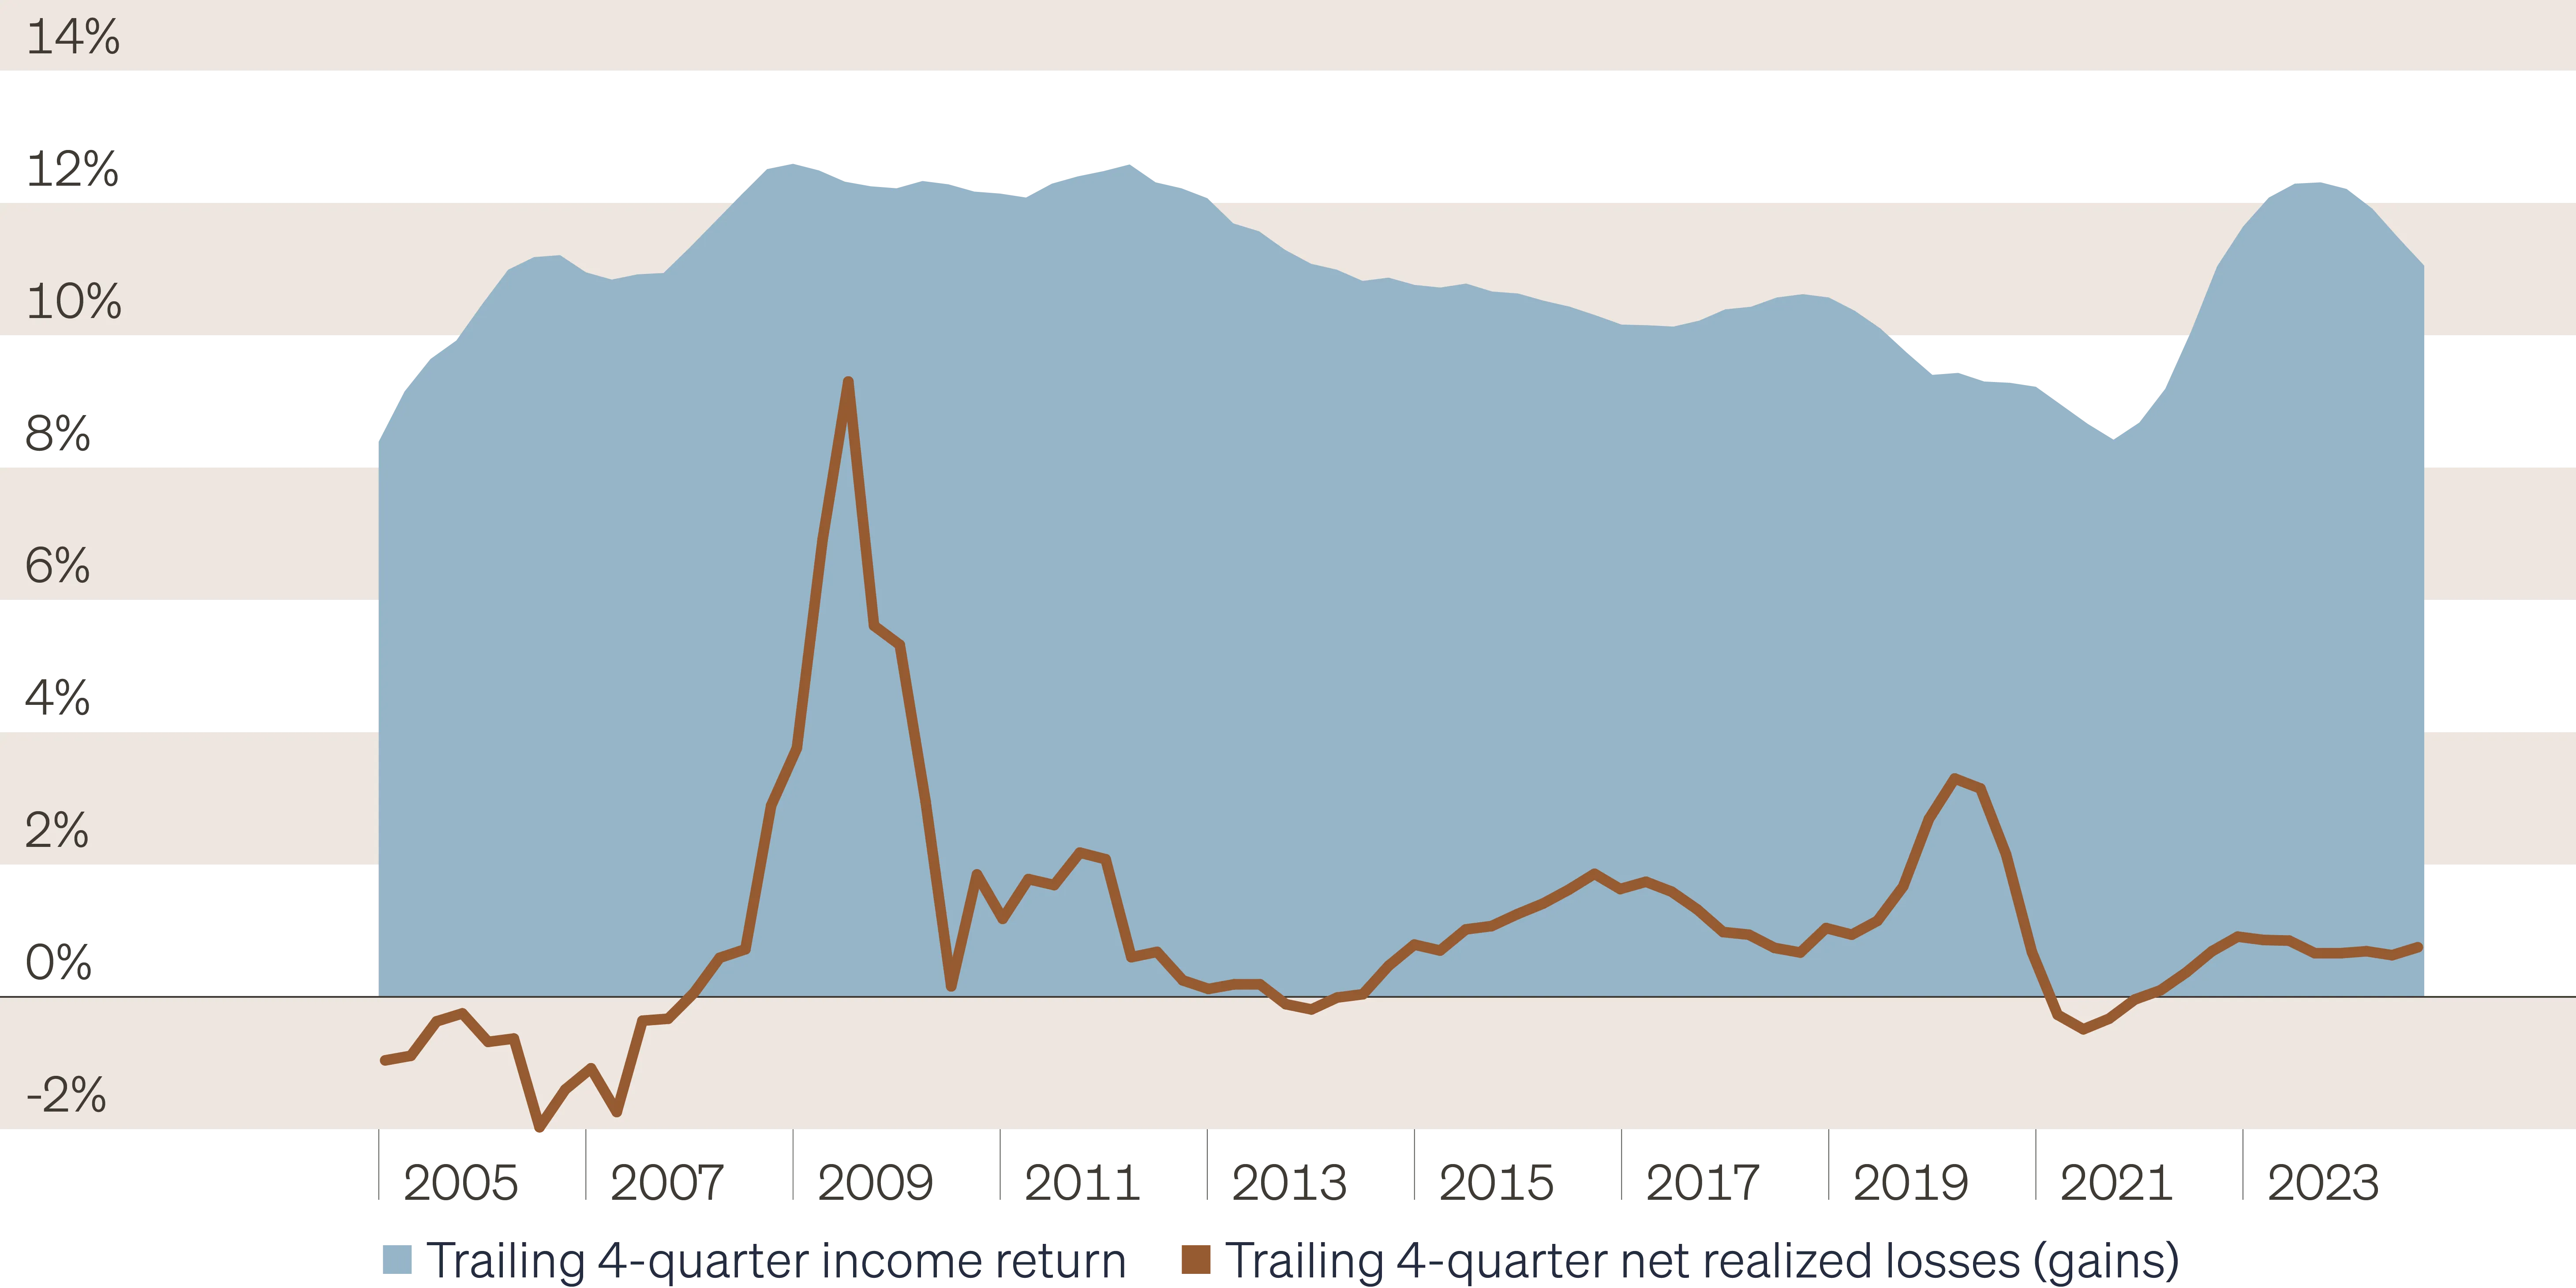
These observations regarding valuation changes around periods of distress are certainly key to understanding periodic total return in downturns, yet most investors take a long-term view toward the asset class. Given unrealized valuation changes tend to net to par over time, an important comparison for long-term investors is the income generation relative to realized losses—the two primary drivers of long-term performance in direct lending.
As shown below, in each quarter since 2005, T4Q income has exceeded realized losses. At the peak of credit losses during each distress period highlighted above, income returns remained comfortably higher than realized losses: GFC (+3.02%), energy distress (+8.44%), and COVID (+6.13%).
Direct lending historical income return and realized losses
It is also worth noting the resilient performance of other private credit strategies outside of direct lending during periods of market distress, particularly around the GFC. The chart below shows median performance of closed-end fund vintages from 2006 to 2010, capturing both funds deploying into the GFC and through the initial recovery. Although short-term performance was challenged, the long-term nature of these vehicles is evident: Median performance across all strategies was positive, including the 2006–2008 vintages most exposed to the depths of the crisis.
Median net IRR by vintage

Tactical traded credit positioning during market distress
Investing in direct lending comes with an implicit trade-off: Committing to long-term, illiquid assets means giving up the flexibility to act tactically in liquid credit markets, wherein investors pursue outsized gains that may result from market dislocations. While the long-term risk premium has generally favored private credit, there have been periods when traded credit—particularly high yield—has delivered stronger results. Around market dislocations, high yield often reprices more quickly, with spreads widening sharply. This creates windows where investors can deploy capital at materially wider spreads than those available in private markets.
Some argue that traded credit pricing is more accurate, with wider spreads reflecting private markets’ slower reaction to shifting sentiment. While private valuations are less reactive day-to-day, history shows that direct lending marks have more closely tracked actual credit performance through distressed periods. By contrast, during market stress, forced selling and thin liquidity can push traded credit prices well below fundamentals—a penalty for liquidity, but also an opportunity for investors able to act quickly.
To evaluate the case for opportunistic positioning, we reviewed five prior spread cycles and compared the relative performance of high yield and direct lending over the following year. Direct lending returns were estimated daily using linear interpolation. We define a spread cycle as beginning at the final trough in spreads prior to spreads beginning to widen, with spreads considered to have normalized once returning to their rolling 3-year mean.1 Across each episode, three distinct periods, or zones, emerge:
- Falling knife zone Spreads are widening and high yield underperforms
- High yield opportunity zone Spreads are above normal and high yield outperforms
- Value trap zone Spreads remain above normal but high yield underperforms
Covid (Jan. 20, 2020-Dec. 2, 2020)
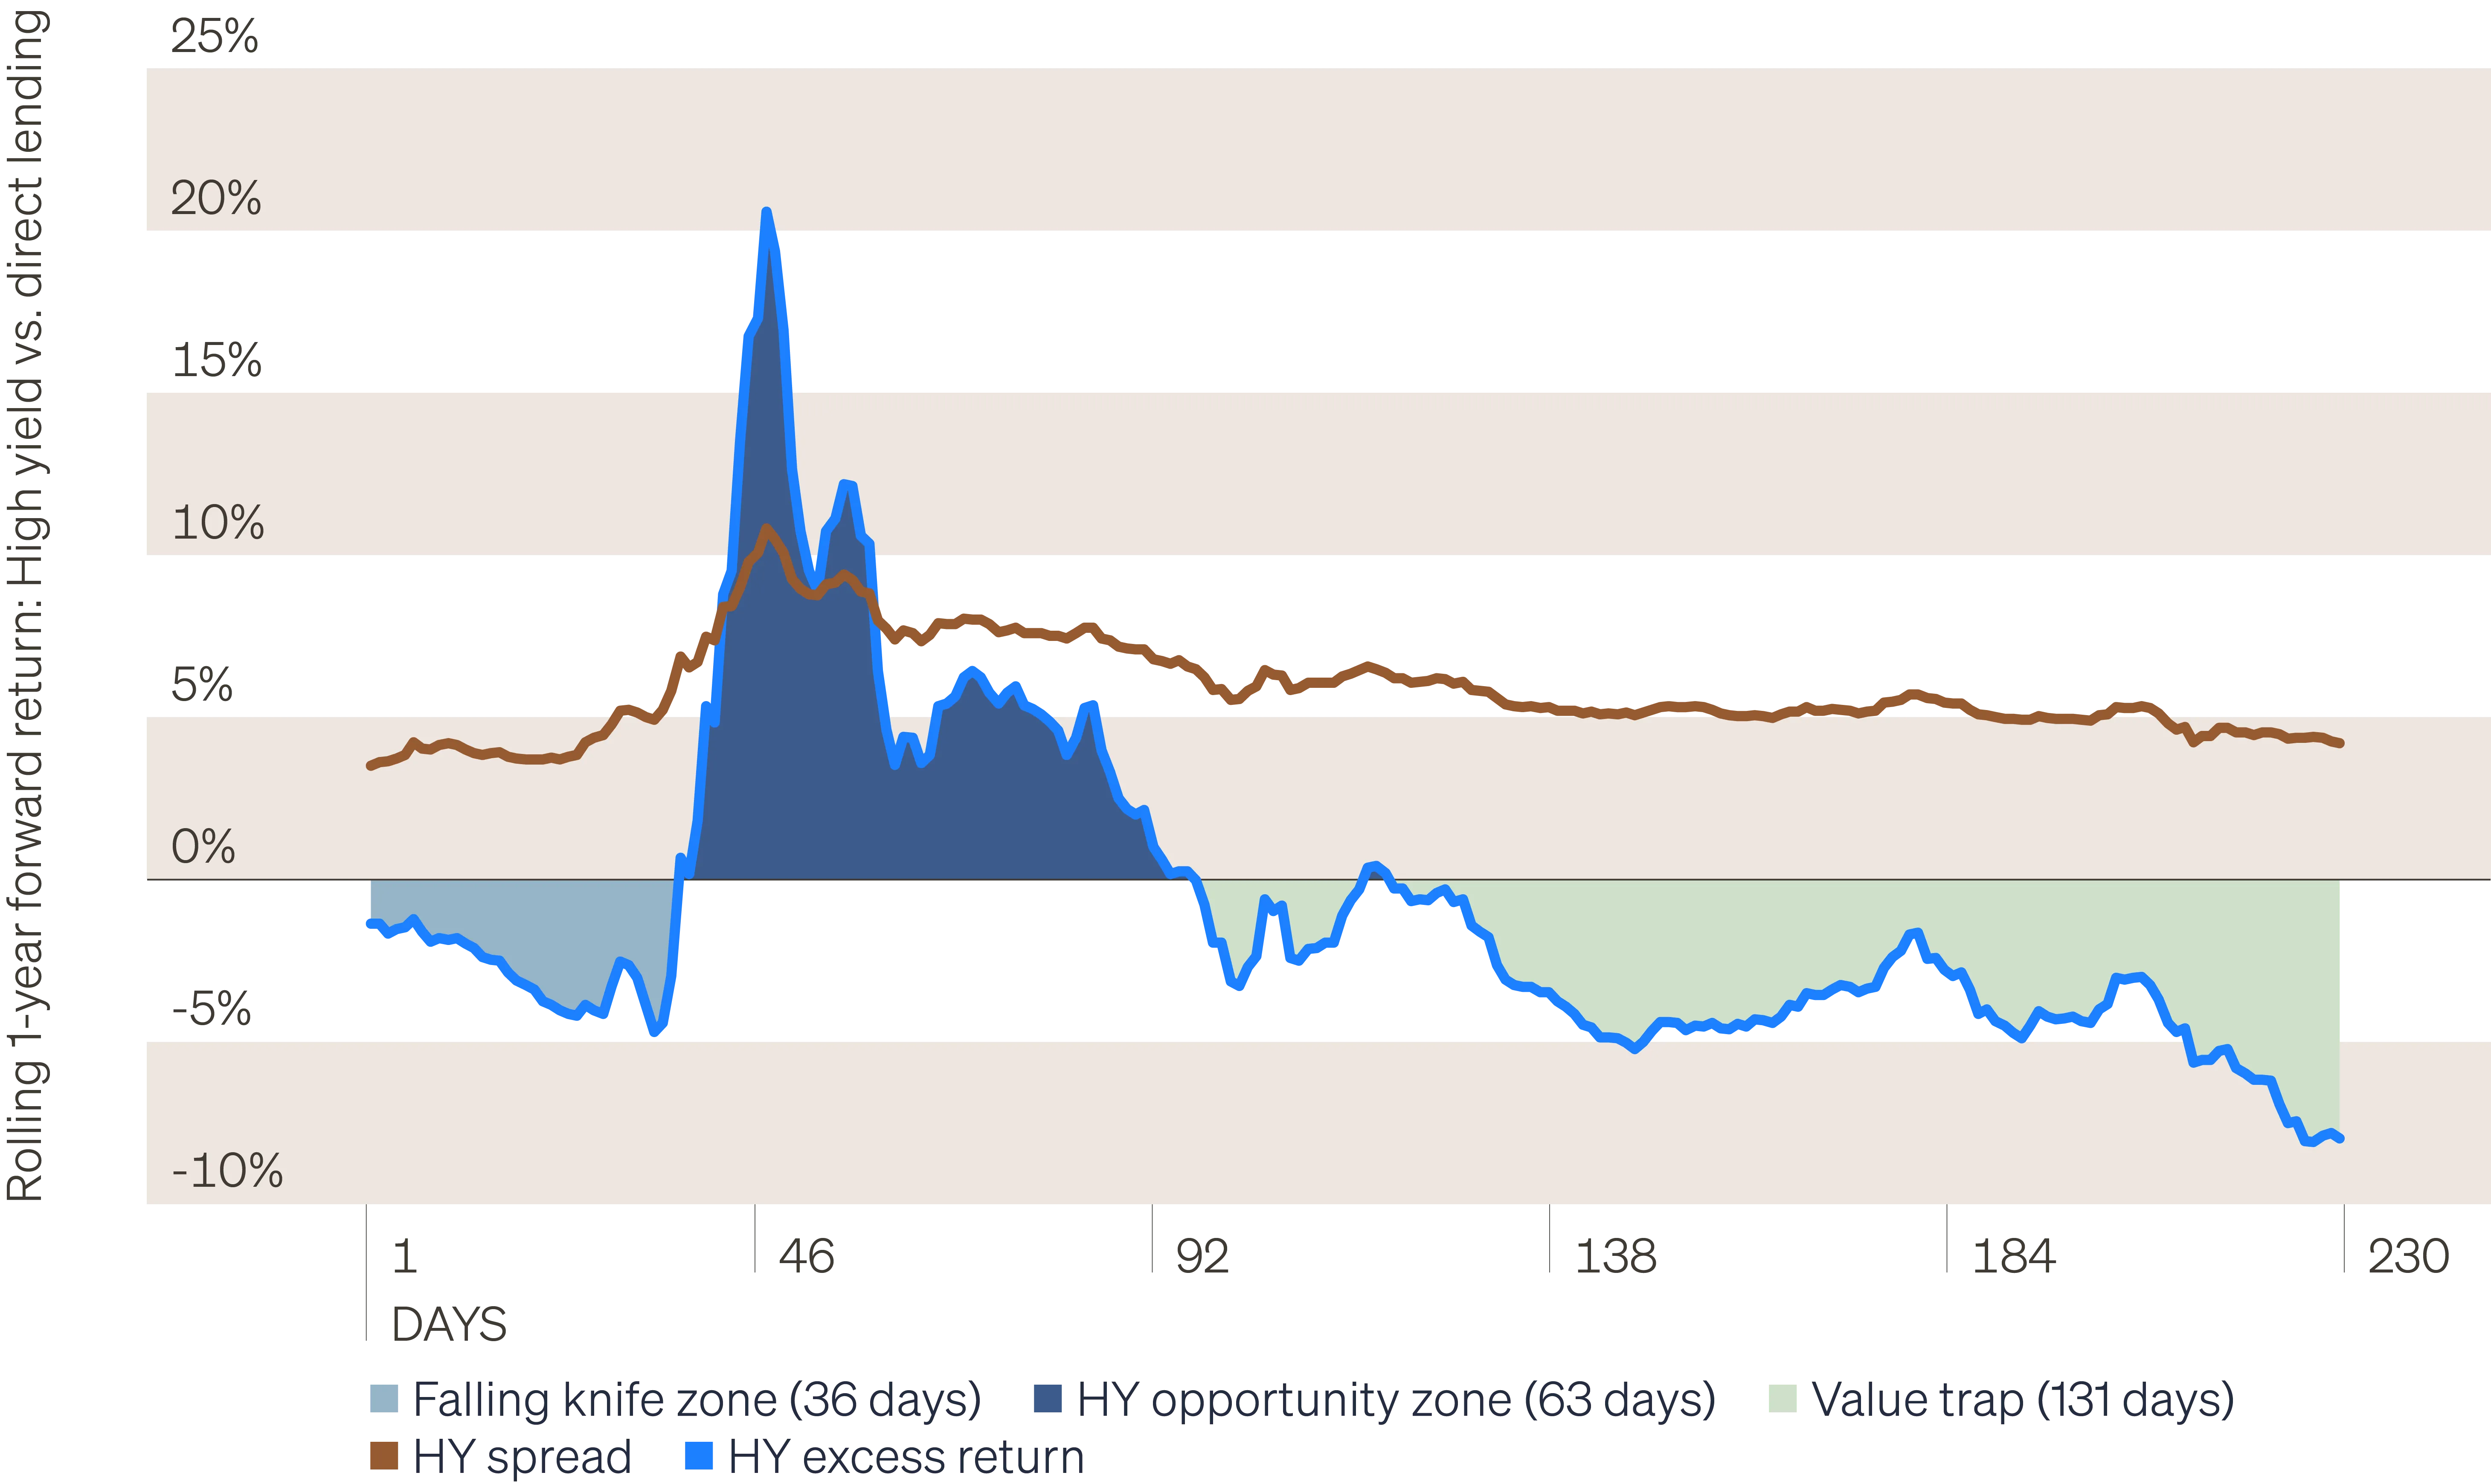
Spread cycle: high yield opportunity zone
We also examine the magnitude of outperformance during the high yield opportunity zone, offering context on whether the excess return is meaningful enough to justify the cost of adding tactical traded credit exposure.
Magnitude of high yield outperformance (trading days)
Primary observations on tactical traded credit:
- Opportunities do exist. The opportunity to outperform in high yield during a distressed cycle appears to be more readily available than during normal market conditions.
- Timing is critical. Spread cycles often include protracted “falling knife” and “value trap” periods where high yield underperforms direct lending over the following year despite elevated spreads. Together, these periods made up 62% of trading days across cycles (71% excluding the GFC).
- Magnitude vs. switching costs. Outside of the GFC, only 8.7% of trading days across four spread cycles delivered outperformance of greater than 5% over the following year—meaning the potential upside of a tactical credit allocation must be weighed against the costs of reallocating capital.
- Windows of opportunity are shrinking. The GFC was unique in the magnitude and duration of the distressed cycle, and may serve as a poor proxy for future distressed credit episodes given the radical changes in market structure the episode brought.
The GFC fundamentally changed capital markets. The period introduced unprecedented fiscal and monetary stimulus to stabilize markets, expanding central banks’ role in staving off left-tail risk, a role further codified during the COVID pandemic. Post-crisis banking reforms are likely to reduce drawdown risk in credit markets, all else equal. The business model of banking, combining high leverage and significant short-term funding, is simply not an ideal vehicle for holding long‑term credit risk. But by limiting banks’ proprietary credit trading—requiring higher capital provisions for credit risk held, and raising the overall shock absorption capacity in the banking system—it’s reasonable to expect banks would contribute much less to the downward pressure on credit assets should a scenario as severe as the GFC occur in the future.
Considerations in the current environment
Finally, with the historical context in mind, we would offer some perspectives on positioning within the direct lending market today and its current resilience relative to prior distress cycles.
The direct lending market continues to grow in size and breadth of participants. The largest managers have become increasingly scaled, dominating fundraising while focusing on large sponsor-backed deals. In contrast, the core and lower middle market is comprised of an increasingly numerous and diverse range of lenders, often with unique specialization across industry verticals and borrower size, serving sponsor and non‑sponsored–backed businesses alike.
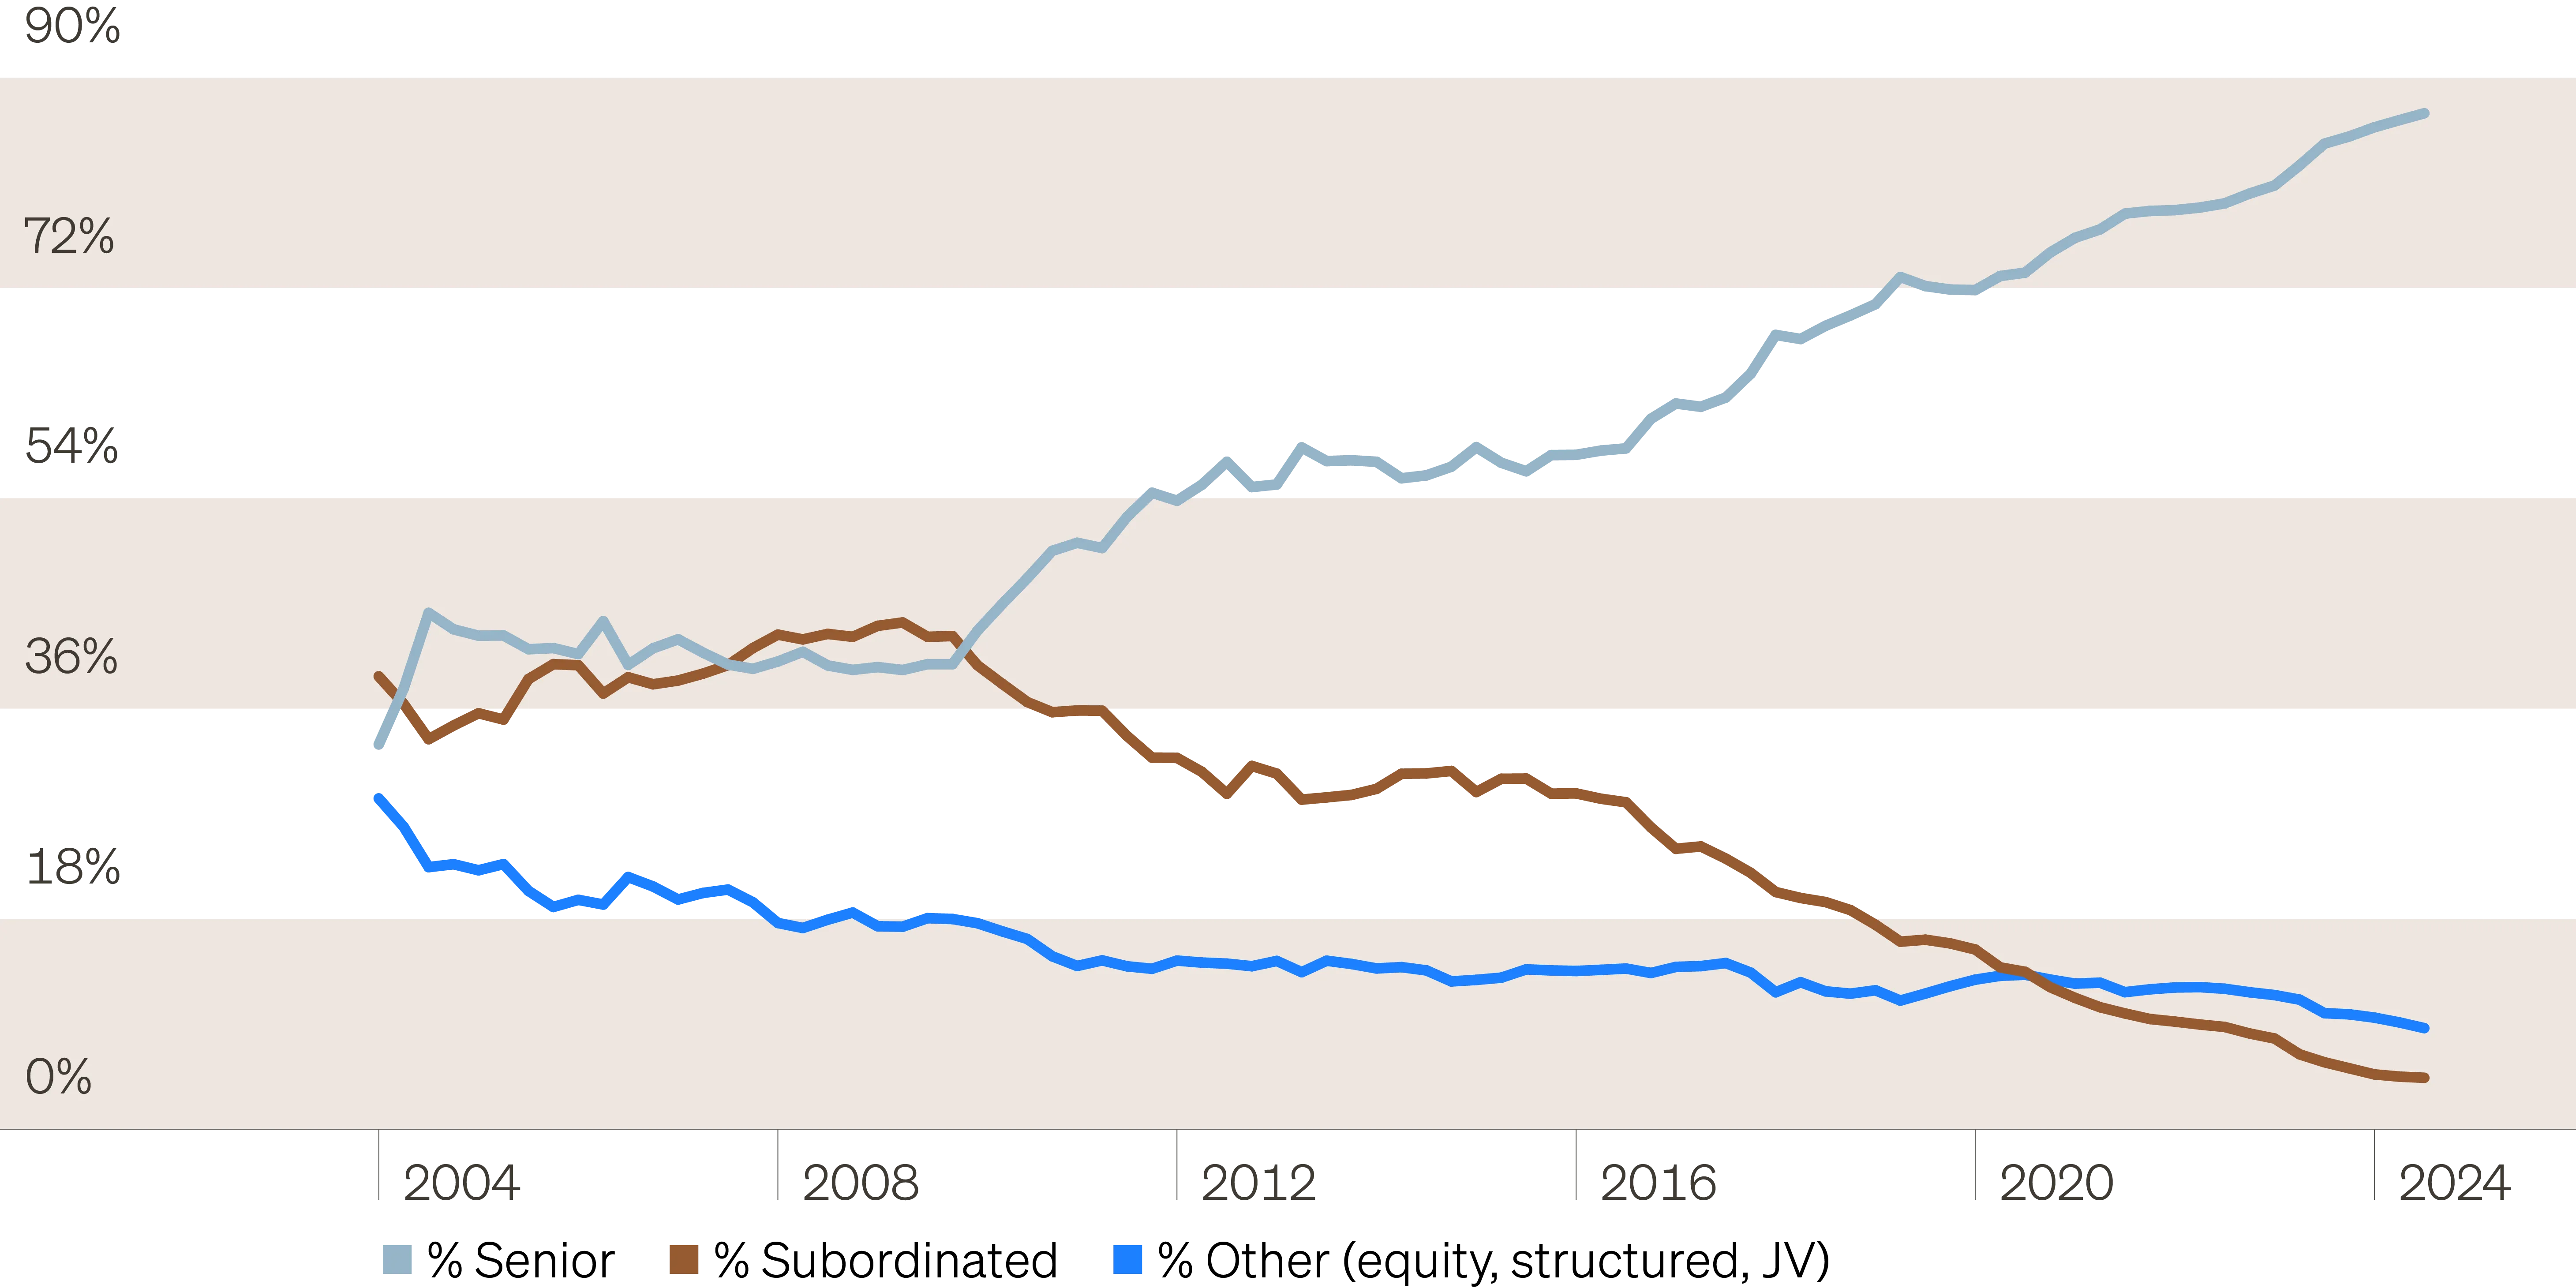
The direct lending market is more concentrated in senior secured debt. Today, direct lenders’ holdings of senior lien assets total 87%. At the start of previous spread cycles, the level of senior holdings for direct lenders was much lower: GFC (41%), Euro banking crisis (43%), energy sector distress (57%), COVID (71%) and 2022 Head Fake (79%). The market has moved up the capital structure, shifting from holding assets in the first and second loss positions to assets last in line for credit losses. In part, this reflects the adoption of unitranche loans, which have become the dominant structure and consolidate what would otherwise have been separate senior and junior tranches. Even so, exchanging higher levels of subordinated, equity and structured credit exposure for unitranche likely improves market’s resilience to periods of heightened distress.
Direct lending market composition
Default trends underscore the superior performance of direct lending compared to syndicated loans. Both markets have felt the impact of higher borrowing costs since the Fed began raising rates in early 2022, yet as of June 30, 2025, the trailing twelve‑month default rate in direct lending was just 1.45%, while non-accruals stood at 1.20% of cost. This compares to a default rate of 3.37% at the end of August for broadly syndicated loans. This represents a noteworthy departure from pre-COVID default trends, when direct lending defaults typically outpaced syndicated loans. The improvement likely reflects the move toward higher quality holdings, the greater incidence of covenants in private credit, and the ability of private lenders to intervene more quickly and flexibly when borrower issues arise.
Income resilience offers buffer to potential credit losses. We utilize a model of the business development company (BDC) market, the vehicle through which many investor’s access private credit, to gauge the market’s forward income potential and ability to withstand credit losses. While individual BDC performance can vary significantly by strategy, capital structure and deployment, our model is designed to provide a baseline view of the market in aggregate. Based on current conditions, we estimate the BDC market is positioned to generate annualized returns just under 9%, excluding the impact of unrealized/realized gains or losses.
As an illustrative example, we apply the same inputs and isolate the increase in nonaccruals and defaults required to result in a 0% return, excluding mark-to-market valuation adjustments. Our analysis concludes this would require a nonaccrual rate of 8.00% of cost value and a default rate of 10.25%—levels never seen in direct lending.2 For context, in traded credit, since at least 1998, a default rate of 10.25% or greater has occurred only once—in 2009 at the peak of market stress during the GFC.
Although short-term performance in private credit may be significantly impacted by unrealized gains and losses, these typically net out over the long run, leaving income generation and realized credit losses as the primary determinants of long-term performance. As shown above, using this framework, BDC vehicles as currently comprised show impressive resilience to a spike in credit losses. The economic situation associated with the scenario presented above would at least rival, or more likely exceed that experienced during the GFC, a period in which direct lending income still exceeded realized credit losses.
Conclusion
Direct lending has been tested across five unique credit cycles: The GFC, the European banking crisis, energy sector distress, COVID and the 2022 recession Head Fake. Across these credit cycles, we have observed several distinct themes. Lenders have proactively marked assets lower in anticipation of credit losses, while having a slower reaction function when revaluing assets higher. In the early stages of distress, lenders have shown caution by valuing assets at levels that overstate expected credit losses to actual outcomes.
Other credit strategies have also presented opportunities in periods of distress, including mezzanine, special situations and high yield. For high yield, there have been periods when opportunistic allocation has produced meaningful outperformance versus direct lending. However, the timing of tactical positioning has been critical, as cycles have also been associated with lengthy “falling knife” and “value trap” periods of high yield underperformance. Critically, since the GFC, the opportunity window in traded credit appears to be narrower, with fewer trading days wherein the magnitude of outperformance may justify timing risk and switching costs.
In assessing private credit’s forward-looking resilience, we reviewed the current positioning of BDCs, a common vehicle for accessing the asset class. Over the past 20 years, BDCs have moved up the capital structure, increasingly holding first lien senior secured risk over junior debt and preferred equity. This, along with better loan documentation, may explain direct lending’s lower default rate versus the BSL market, a more recent development. We estimate the forward return profile of the typical non‑traded BDC, net of expected credit losses, to be approximately 8.8% annualized. This is consistent with the long-term performance of the vehicle, and in our view, represents attractive risk-adjusted income. We also stress the vehicle, isolating the combined nonaccrual and default rate required to produce a 0% net income return, which excludes unrealized changes in fair value, and holds constant all other model inputs. Based on our hypothetical average BDC vehicle, it would require nonaccruals of 8.00% and defaults of 10.25%—a deep and protracted recession—to meet the 0% threshold.
Direct lending continues to gain market share in commercial lending, helping to meet the borrowing needs of a diverse base of private U.S. firms, even as banks have withdrawn from the market. Share gains have been fueled by borrower preference and the resilient performance of BDCs, which have proven well-designed to hold illiquid long‑term corporate credit risk. Going forward, we expect the systemic benefits of diversifying the base of lenders and capital structures through which credit provision occurs will be more fully appreciated. Indeed, this is the innovation of private credit—the creation of vehicles expressly designed to hold specific types of risk. As private credit matures and banks build partnerships servicing the industry, we expect the value proposition of risk specialization will drive penetration into real estate lending and asset-based finance. Just as resiliency has supported private credit’s growth in commercial lending, thoughtfully adapting product vehicles to the risk of these markets will be critical to preserving resilience in private credit and spreading resilience to the broader financial system.