

As the collective engine of the U.S. economy, middle market companies have long outperformed their public market peers across key measures such as revenue and employment growth. While the results are well established, the question remains: how do these companies create value—and what role does private equity play in improving operations and giving business leaders the confidence to grow?
To explore these questions, Future Standard partnered with the National Center for the Middle Market to examine private equity’s impact on growth, performance and sentiment across the U.S. middle market. We surveyed 407 executive decision makers from middle market companies and drew on the Center’s historical data going back to 2012. The findings are clear: middle market growth is closely tied to how that growth is funded—pointing to meaningful opportunities for companies, private equity and private credit investors alike.
- Navigating private equity’s new era
- Insight 1: Private equity-backed firms drive growth
PE-backed middle market companies have grown revenues five percentage points faster than non-PE-backed peers over the past year. - Insight 2: Private equity ownership boosts results
78% of executives at PE-backed companies cite PE involvement as “very” or “extremely” important to achieving growth plans. - A look at private credit in the middle market
- Insight 3: Costs and complexity rise
Middle market firms cite cost of capital, performance targets and complexity as the top challenges related to PE ownership. - Insight 4: Private-equity-backed firms stay optimistic
Companies with PE backing are significantly more likely to be undertaking expansionary activities like launching a new product or expanding into new markets. - Insight 5: Liquidity planning accelerates
65% of PE-backed middle market companies are exploring liquidity options, compared to just 35% for non-PE-backed companies.
Explore the insights from The National Center for the Middle Market and Future Standard below, then get the complete report.
Navigating private equity's new era
Perspective from Future Standard
Private equity has delivered outsized returns historically, outperforming the S&P 500 by more than 5% per annum over the past 25 years, while top-performing managers have added substantial incremental return. But today, the market stands at an inflection point. The sources of return are shifting as financial markets confront a new investing era.
Higher interest rates, elevated valuations, and greater policy and geopolitical uncertainty each present fresh challenges for public and private markets alike. For private equity, these changes are diminishing the role of financial engineering—namely, the reliance on leverage and a market-wide valuation uplift—and pushing operational value creation to the fore. As this research highlights, the U.S. middle market represents a fertile ground for managers to harness operational levers and thrive in this new environment.
Understanding how these changes impact investors first requires breaking historical returns into their components. In the simplest analysis, private equity performance can be segmented into three categories:
- Earnings growth, driven by operational improvements at the company level that power revenue growth and margin expansion
- Multiple expansion, which can be driven by a market-wide phenomenon—like declining interest rates—or a manager’s ability to improve a firm’s growth outlook and/or stability
- Financial leverage, or the use of debt, which magnifies the success (or failure) of other drivers
The relative importance of these performance drivers has oscillated throughout the asset class’ history. As the chart below demonstrates, major macroeconomic events have bookended three distinct periods in private equity buyout’s history.
The drivers of PE returns have shifted over time
Drivers of global buyout returns by time period
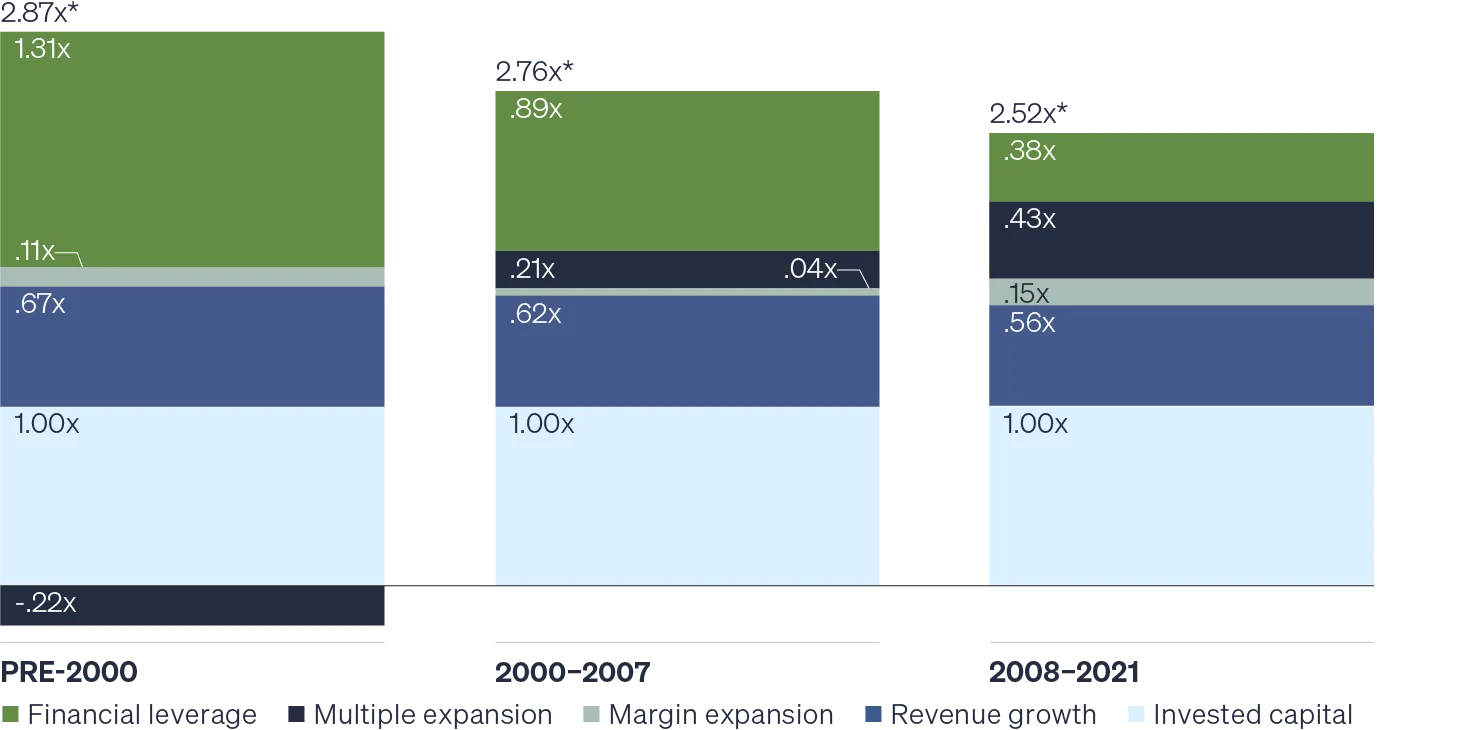
Source: Matteo Binfare, Gregory Brown, Andra Ghent, Wendy Hu, Christian Lundblad, Richard Maxwell, Shawn Munday, and Lu Yi, "Performance Analysis and Attribution with Alternative Investments," as of January 24, 2022.Note: Returns shown exclude initial invested capital.
From the market’s advent in the late 1970s/early 1980s through 2000, substantial use of leverage accounted for more than half of industry returns. During the 2000s, leverage remained a primary return driver, but the market also benefited from modest valuation expansion. After 2008, financial reforms limited utilization of leverage, but falling interest rates created an extended period of rising equity multiples. Today, we believe the private equity market is in the early stages of its fourth major era, precipitated by the COVID pandemic, subsequent inflation, and the ensuing rise in interest rates.
Three major shifts define this new era:
- Interest rates across the yield curve have normalized and are likely to remain elevated relative to the previous era, even as the Fed cuts. Higher rates increase borrowers’ interest costs and limit the amount of leverage available for buyout transactions. Higher interest rates also increase discount rates, creating headwinds for valuation multiples.
- Private valuations, while still below those in publicly traded equity markets, are elevated relative to history. Higher entry multiples raise the bar for further valuation increases, especially without an interest rate tailwind.
- Policy and geopolitical uncertainty have increased substantially and are unlikely to abate. This presents new risks—and potentially opportunities— for firms across industries, adding new layers of complexity to the underwriting process and necessitating flexibility and innovation from management teams.
This framework produces a clear takeaway: Operational levers have come to dominate the private equity return outlook, reducing financial levers to a supporting role. That is not to say financing decisions will be unimportant—balance sheet structure and financing creativity will remain critical to ensure ample capital is directed to value creation initiatives. However, the ability for private equity managers to partner with firm management to push organic revenue growth, margin expansion and accretive acquisitions will be the ultimate arbiter of investment success.
This report lays out the avenues by which private equity-backed firms drive this value creation, and the role their executives see PE ownership playing. The vast majority of executives within PE-backed firms in the survey report a positive impact from their PE partner on strategic planning and innovation—essential competencies for powering organic growth. Eighty-two percent say their PE partner has improved their access to capital, a crucial element when exploring strategic acquisitions. And more than 80% cite a positive effect from PE on their firm’s efficiency and margins. The proof is in the pudding—private equity ownership is associated with a 3.6 percentage point revenue growth premium over the past decade and a 1.4 point EBITDA margin premium in the most recent fiscal year.
While the departures of low interest rates and market-wide valuation expansion are challenges for the industry, the opportunities for value creation have rarely been more compelling. From artificial intelligence and automation to dynamic pricing strategies, PE managers have more tools at their disposal than ever before. However, segment selection will matter more than ever. Over half of middle market buyout transactions involve a firm not previously owned by a financial sponsor, making them prime targets for PE managers’ growth initiatives. This stands in stark contrast to the targets of large buyout managers, many of whom have had one or multiple prior private equity owners.
The challenges from higher rates, elevated valuations and global uncertainty are not unique to private equity, but the ability to drive operational improvement through active, hands-on management is. We firmly believe private equity strategies still hold the potential to drive significant value for portfolios, but investors must be precise in seeking out the segments and managers best positioned to thrive in this new era. In short, while the easy levers are gone, the opportunity for skilled middle market managers to create durable value has rarely been greater.
Private equity-backed firms drive growth
Insight 1: Middle market companies with private equity ownership report stronger and more profitable growth than their non-PE-backed peers.
Grow this a hallmark of the middle market, and middle market leaders care deeply about achieving it. Middle Market Indicator data illustrate that private equity-owned companies have been more successful at achieving growth across revenue, EBITA and headcount than their non-PE-backed peers.
Revenue growth
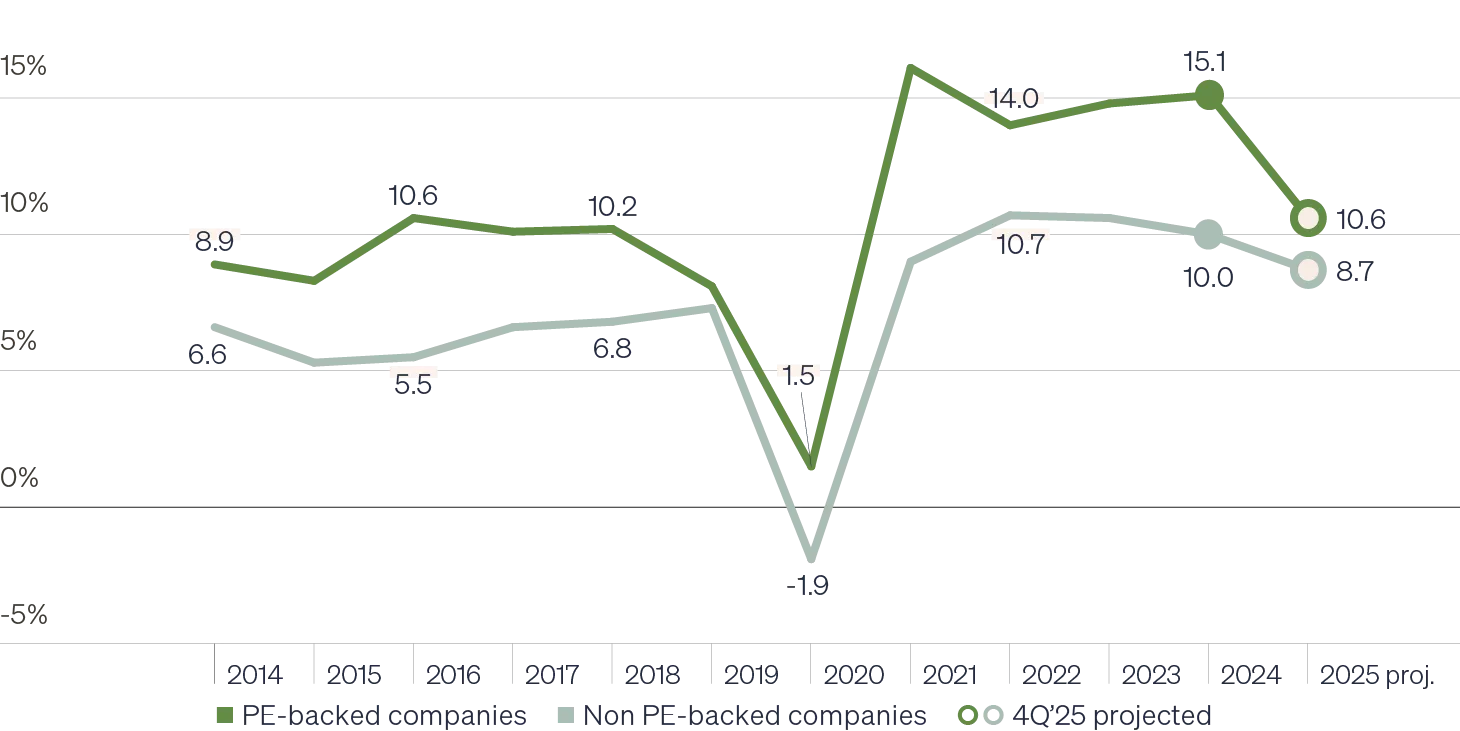
From July 2024 through July 2025, PE-backed middle market companies collectively reported 12.9% year-over-year revenue growth compared to 10.4% for their peers with no PE investment. This revenue growth gap has been present in every reporting cycle since 2014. And results from this latest survey align with historical trends reported previously in the National Center for the Middle Market’s Middle Market Indicator report. Among the portfolio companies, 61% experienced double-digit top-line growth, while just 50% of non-PE-funded companies reported the same.
These results likely reflect PE-funded companies’ sharper focus on efforts to drive growth. For example, 51% of PE-backed companies introduced a new product or service during the reporting period compared to just 35% of their non-PE-backed peers. PE-funded companies were also nearly twice as likely as their non-funded peers to have opened a new plant or facility or to have made an acquisition, illustrating more aggressive organic and inorganic growth activities.
PE-backed middle market companies grow revenue faster than companies with no PE funding
Employment growth
Notably, employment growth rates illustrate a similar pattern. While a popular notion suggests that headcount is often slashed when private equity enters the business, the reverse appears to be the case in the middle market, where PE-backed companies consistently grow employment faster than their peers.
While the overall U.S. economy grew total employment only 1.2%, the PE-backed portfolio companies in our study increased the workforce at an average year-over-year growth rate of 9.0% between July 2024 and July 2025. Overall, 64% of the PE-backed companies reported employment growth, and two out of five companies experienced double-digit growth during this period.
Notably, only 35% of PE-owned firms indicate challenges with attracting and retaining talent compared with 47% of their peers. This may be partially attributed to the network of management contacts that PE partners bring to their portfolio companies.
More PE-funded companies grey employment over 10% in the last 12 months
% of past year revenue change

EBITDA growth
Companies with private equity ownership demonstrate greater EBITDA margin performance as well. PE-backed companies report an average EBITDA margin of 13.7% for the most recent fiscal year compared to 12.3% for companies with no PE backing. Companies wholly owned by private equity reported an average EBITDA margin of 15.3%, a performance potentially driven by enhanced control and targeted operational improvements. Perhaps more notably, while the vast majority of all companies reported EBITDA margin improvements over the past three years, PE-backed companies are nearly twice as likely as their non-PE-backed peers to describe those improvements as significant.
PE-backed companies grey EBITDA faster as well
% of companies citing three-year improvement in EBITDA margins

Private equity ownership boosts results
Insight 2: Middle market business leaders indicate that private equity ownership has a direct, positive impact on growth and performance.
78% of private equity-backed firms cite PE involvement as very or extremely important to achieving their growth plans.
Leaders of middle market businesses with private equity ownership attribute their impressive growth numbers, at least in part, to the contributions of their private equity partners. Middle market portfolio companies point to access to growth capital as the number one benefit of PE funding. That capital is not only PE-sourced; this group of companies also enjoys much better access to credit than their non-PE-backed peers, both from banks and increasingly important private lenders.
Alongside the dollars to make growth happen, funded companies also cite faster decision-making as a key advantage of the relationship. This perhaps stems from operating partners’ need to move quickly to generate value creation within a time-limited holding period. Notably, PE firms’ influence isn’t viewed as simply about optimizing the current performance numbers. More than a third of companies cite the acceleration of long-term goals as a key benefit of private equity ownership.
Further, compared to non-PE-owned middle market companies, PE-owned companies consistently give higher ratings to company performance across a range of strategic, financial and management metrics, including strategic planning and long-term vision. In several areas, including innovation, operational efficiency, margin improvement and R&D investment, PE-backed companies are more likely to state they’re doing well. For example, PE-backed companies are more than 1.5 times as likely as non-PE-backed companies to say they are doing very well in their innovation efforts.
In all areas, business leaders cite private equity as having a direct, positive and often major impact on performance, especially in the areas of strategic planning, long-term vision and innovation. These sentiments signal that PE backing may afford benefits that outlast the holding period and drive strong long-term growth for the business, going beyond an investment firm’s desire to capitalize on a quick sale.
PE-backed companies view PE as directly contributing to performance
% of PE-backed companies citing a positive impact from PE on their performance in the following areas

A looks at private credit in the middle market
Motivations and usage of private credit by middle market companies
In many cases, private equity and private credit go hand in hand. Private credit offers another funding option for middle market companies. Like commercial bank loans, private credit is debt. The difference is that the capital for this lending activity is provided by long-term investors, not short-term deposits. This translates into greater flexibility and faster execution, the most frequently cited benefits of this type of lending. Custom solutions, relationship-based lending, higher certainty of closing and fewer restrictions are additional noted advantages. Further, for some businesses, private credit allows for the retention of ownership.
Among the middle market companies surveyed, 84% of businesses with private equity ownership also use one or more forms of private credit. To pursue aggressive growth goals, companies often require financing that goes well beyond what banks can provide. Private credit lenders have stepped into this role by offering customized solutions tailored to capital needs and structures, and by extending credit where banks may be constrained.
Reflecting this flexibility, 28% of companies cite the willingness of private credit providers to fund riskier or nontraditional uses as a key benefit. The result is that private credit has become the dominant financing tool for leveraged buyouts, surpassing both the syndicated loan market and traditional banks.
Across all types of private credit, nearly three quarters of users (72%) say it plays a very or extremely important role in achieving current growth goals, and nearly all companies (98%) say the private credit experience has met their expectations; in fact, it exceeded those expectations for 53% of companies.
Top benefits and challenges of private credit compared to traditional bank financing
% of private credit users citing each benefit or challenge

Costs and complexity rise
Insight 3: Cost, performance pressures and complexity are key challenges with private equity.
While a clear correlation exists between private equity funding and growth and performance in the middle market, new ownership structures can and do introduce new challenges for companies.
Half of middle market companies with PE funding point to the high cost of capital as a top challenge, making this the most prevalent challenge cited. The costs are often a byproduct of higher indebtedness for these businesses, typically driven by the goal of driving rapid growth, both organically and through acquisitions. Nearly half of companies mention pressure to meet short-term performance targets and additional reporting requirements as other major burdens for the business.
Compared to companies without PE funding, private equity portfolio companies are significantly more challenged by issues that go together with increased business complexity and a presumably more aggressive growth agenda. These include taxes and tariffs, rising interest rates, supply chain disruptions, integrating emerging technologies including AI, regulatory compliance and geopolitical issues.
Presumably, the benefits of PE ownership, including enhanced strategic planning capabilities and professionalization of management processes, equip the PE-backed businesses and their management teams to better address these issues as they arise.
More than 30% of the companies surveyed accepted private equity capital for the first time within just the last two years. While many companies currently see little need for outside equity, future considerations such as succession planning or liquidity for founders may shift perceptions and increase openness to private equity capital.
Cost of capital and performance pressure cited as top challenges
% of PE-backed companies ranking an issue as one of their top three challenges related to the private equity experience

Private equity-backed firms stay optimistic
Insight 4: PE-owned middle market businesses are more prepared for and optimistic about the future.
With policy and macro uncertainty elevated in today’s political and business landscape, confidence indicators are showing signs of decline across the economy, and the middle market is no exception. PE-backed middle market companies, however, appear more confident in their ability to navigate these and other challenges than their non-PE-funded peers. Among middle market portfolio companies, 45% express a very optimistic long-term outlook for U.S. businesses, while just 35% of companies without any PE ownership share the same sentiment.
REVENUE AND EMPLOYMENT GROWTH PROJECTIONS
While a greater share of non-PE-backed companies expect some revenue growth (78% vs. 68%), the PE-backed companies project faster growth on average, with nearly half anticipating double-digit gains compared to just 35% of non-PE-backed peers.
From an employment perspective, nearly two-thirds (64%) of PE-backed businesses expect ongoing workforce growth, with 43% saying they will grow headcount at a rate of 10% or more.
PE-backed companies are more likely to anticitpate double-digit future revenue and employment growth
% of companies anticipating stated level of revenue growth

% of companies anticipating stated level of employment growth

Expansionary plans
PE-backed companies are significantly more likely to have specific expansionary plans in place for the next 12 months, including raising capital and expanding into new markets. These plans may be directly tied to the need to scale within the parameters of the holding period or to fund strategic growth initiatives. A greater willingness to raise new equity investment or open a new line of credit may be tied to operating partners’ comfort with using debt as a growth lever or presumably higher overall appetite for risk.
Preparedness for disruptions
Perhaps because of their perceived easier access to funding, better agility and strength in innovation, PE-backed companies are twice as likely as non-funded businesses to feel very prepared to handle future disruptions. Specifically considering the threat of recession, a third of PE-backed businesses feel very prepared to weather the storm compared to just 22% of companies without funding.
Liquidity planning accelerates
Insight 5: PE-backed firms are more likely to be planning and exploring liquidity events.
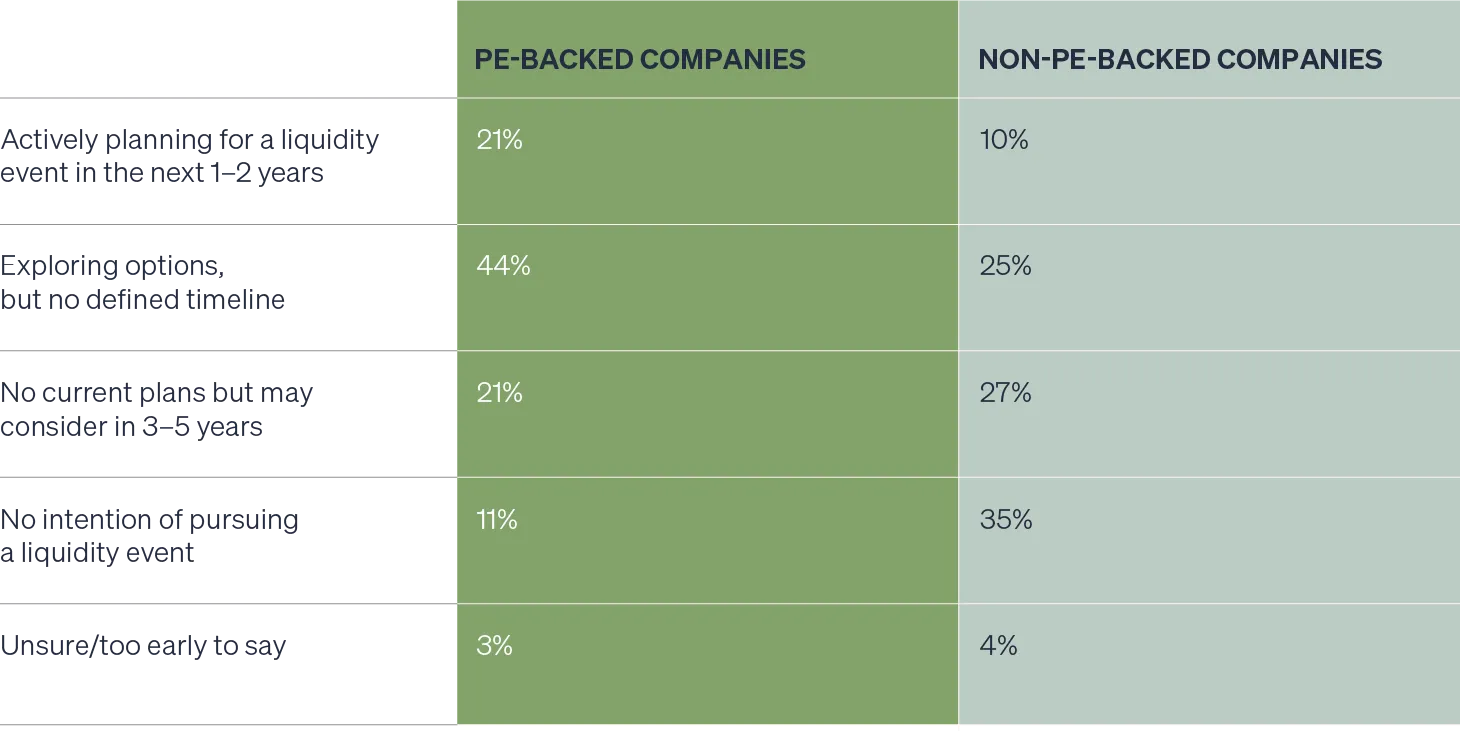
Ina period of slower M&A activity and deal volumes overall, it’s important to note that PE-backed middle market companies are highly focused on liquidity events. Nearly two-thirds (65%) of companies are exploring liquidity options, and around a third of these companies are actively planning an event within the next 24 months. While it’s not surprising that PE-backed businesses are significantly more liquidity-minded than their non-PE-backed peers, it is interesting to note that more than 60% of companies without backing would at least consider liquidity as an option at some point in the next five years pointing to a large set of potential targets for middle market PE managers.
Generally, middle market companies have a larger variety of exit options compared to their larger peers, and they are open to considering a wide range of liquidity events and transition types. Recapitalization via private credit or structured equity is the most popular option, followed closely by a strategic acquisition by another entity. Funded middle market companies are significantly more likely than their peers without PE funding to be contemplating public offerings or management buyouts, all of which signals a high likelihood of structured exit planning happening within these businesses.
Within non-PE-funded companies, approximately one out of five say they would at least consider selling to private equity. While two out of five companies say they are unlikely to engage with a PE firm directly, 24% expressed openness to a strategic acquisition by another company—a pathway that may nonetheless lead to private equity involvement, given the frequency of roll-up strategies among PE-backed platforms.
PE-backed companies are much more likely to be planning of exploring a liquidity event than non-funded businesses
% of companies planning an event
Go in depth on how private equity and private credit drive value creation in the middle market. Download the complete report from The National Center for the Middle Market and Future Standard.