KEY sections
Commercial real estate (CRE) touches nearly every part of our daily lives, from housing and offices to warehouses, hotels and neighborhood shopping centers. The debt used to finance these properties may provide attractive income and portfolio stability backed by tangible assets, yet the asset class remains underrepresented in many investors’ portfolios.
authors
Michael Ludlow
Michael Ludlow
Head of Research and Fund Communications

CRE debt: Receiving first priority

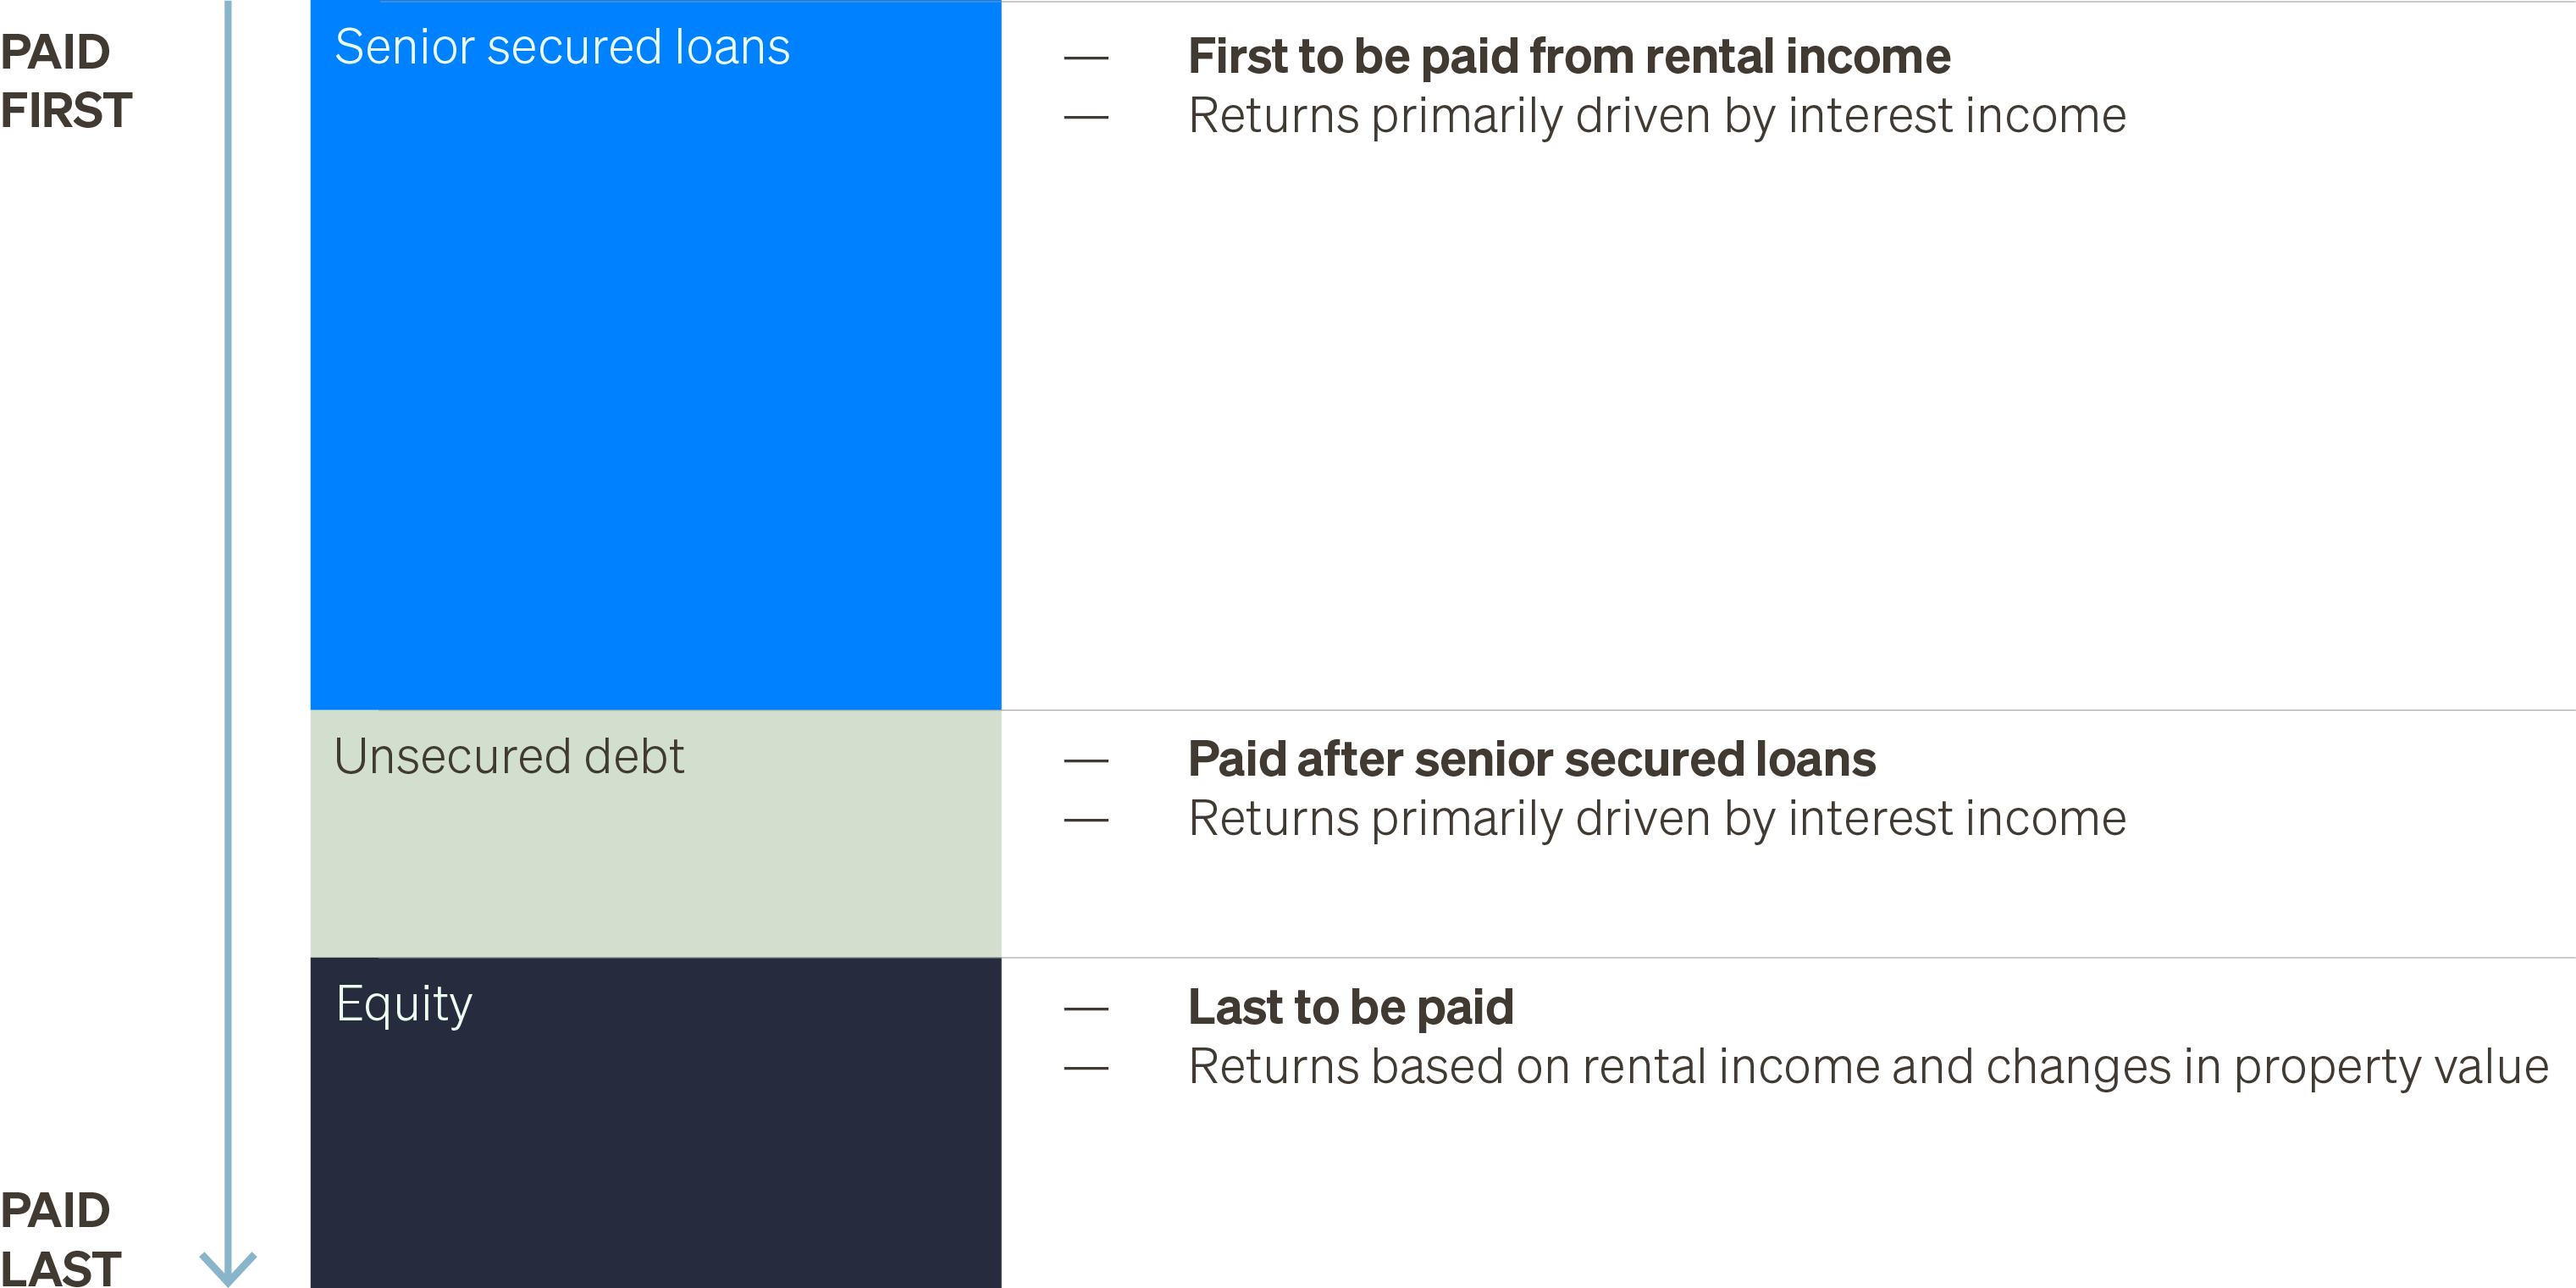
Investors in commercial real estate debt serve as lenders to property owners to help purchase, renovate or repurpose a property. An investor’s return is largely driven by the interest income from the loan (or other form of debt). CRE debt investors are paid ahead of property owners, offering greater downside protection if a property’s income declines or value decreases.

Figure 1: Illustrative commercial real estate property capital structure2

A potential source of income and portfolio stability

Commercial real estate debt investors are paid from a property’s income before the property owner, giving them priority in the cash flow of the building. This senior position can help provide more stable income, particularly during periods of market stress or economic downturns.

In addition, CRE lenders typically finance only a portion of a property’s value, which creates a cushion against potential losses if property values decline. Using the hypothetical example in Figure 2, if a property’s value falls by 15%, the reduced value still fully covers the mortgage, while the property owner’s equity value is cut in half.

Figure 2: Impact of property value changes, CRE debt vs. Equity investors

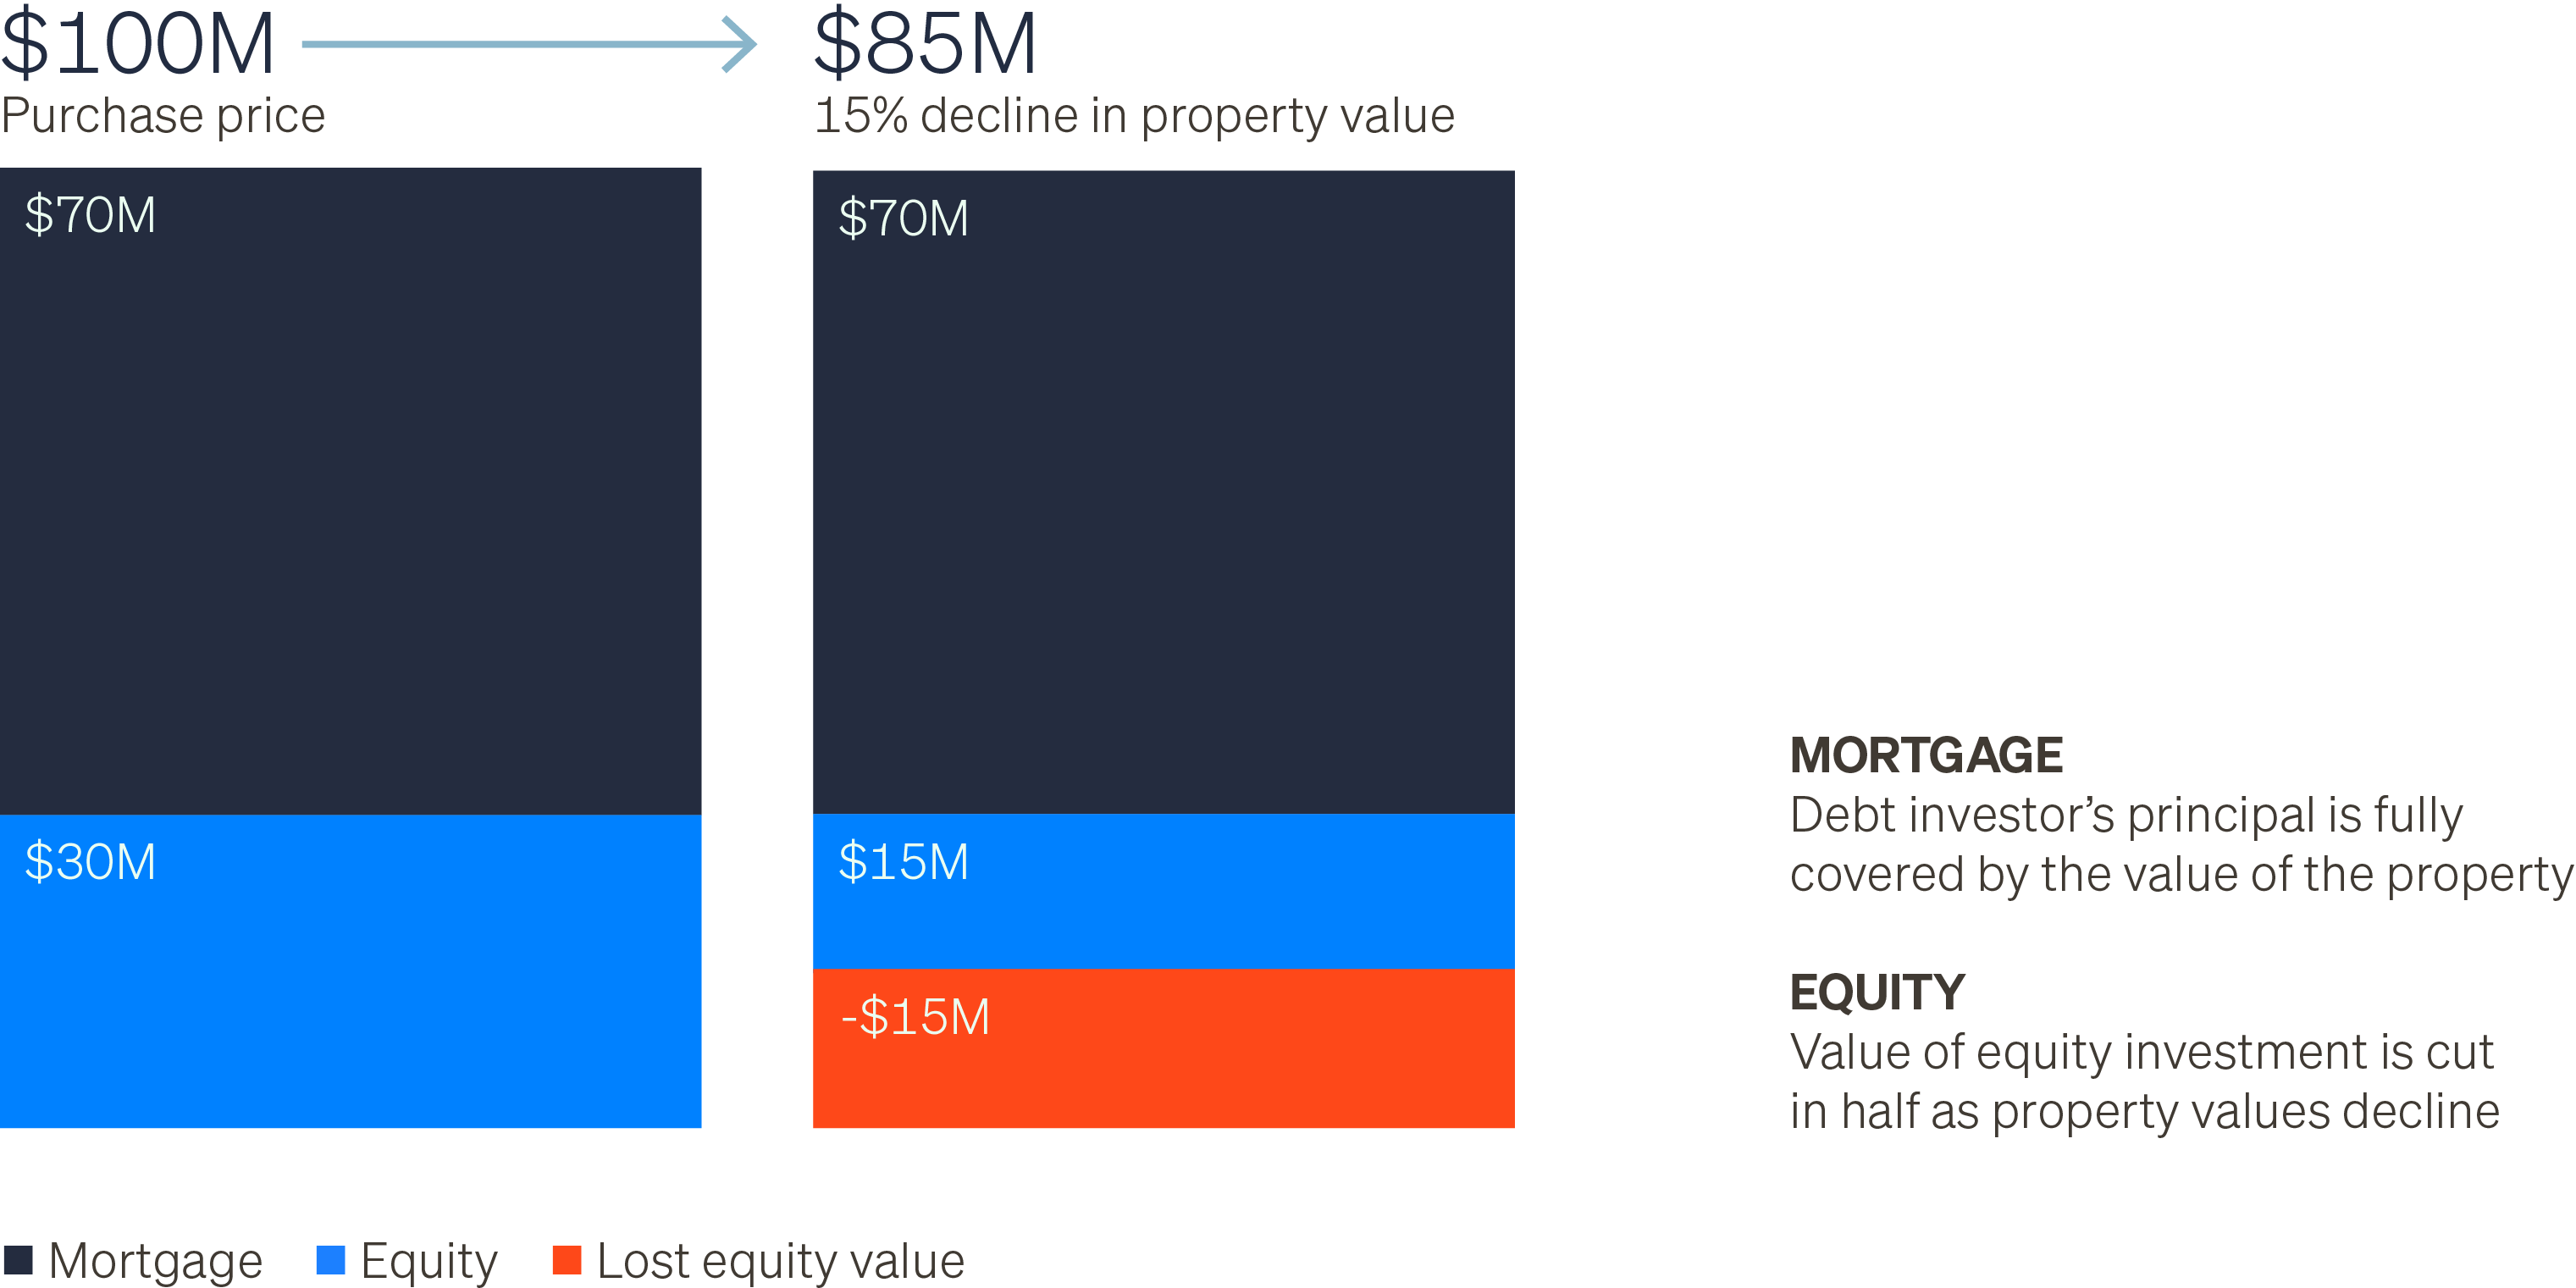
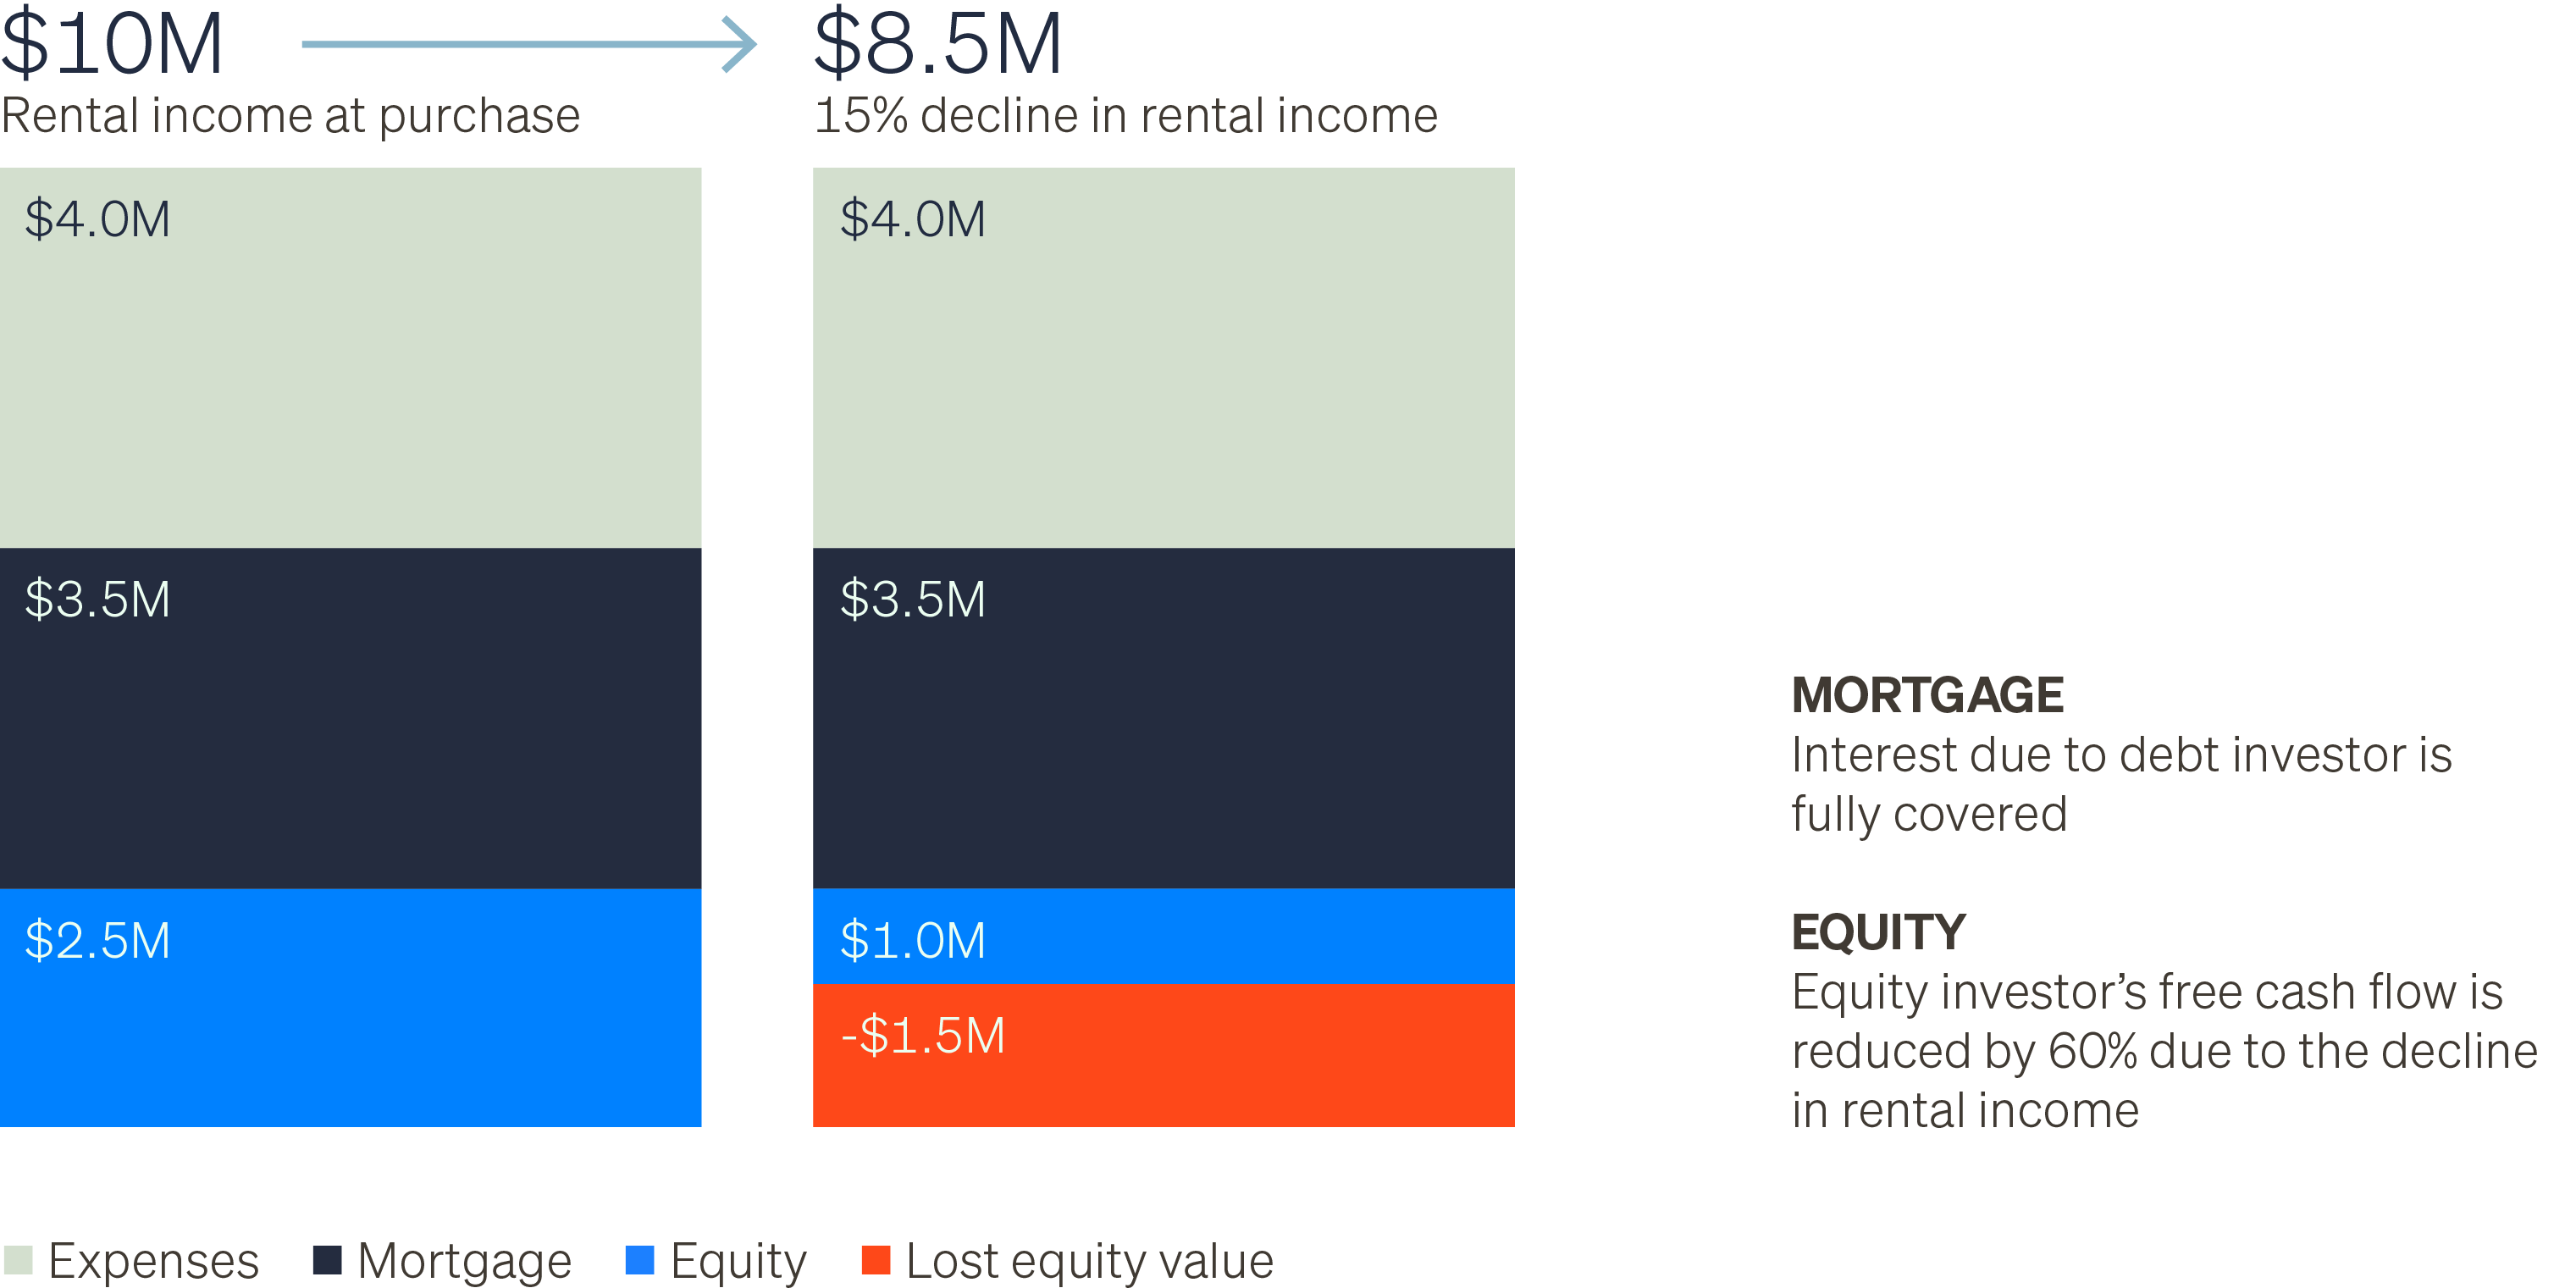
Figure 3 shows how CRE debt investors may also be better protected if a property’s rental income declines, whether from vacancies, renovations or lower market rates. After operating expenses such as taxes, insurance and maintenance are paid, rental income is used next to cover mortgage payments owed to commercial real estate debt investors. Any remaining cash flow goes to the property owner. In this example, the property experiences a 15% decline in rental income. While there is still enough cash flow to cover operating expenses and the mortgage payments, the income flowing to the property owner is significantly reduced.

Figure 3: Impact of changes in rental income, CRE debt vs. Equity investors

Charts are provided for illustrative purposes only.

Income is dominant driver of CRE returns once again

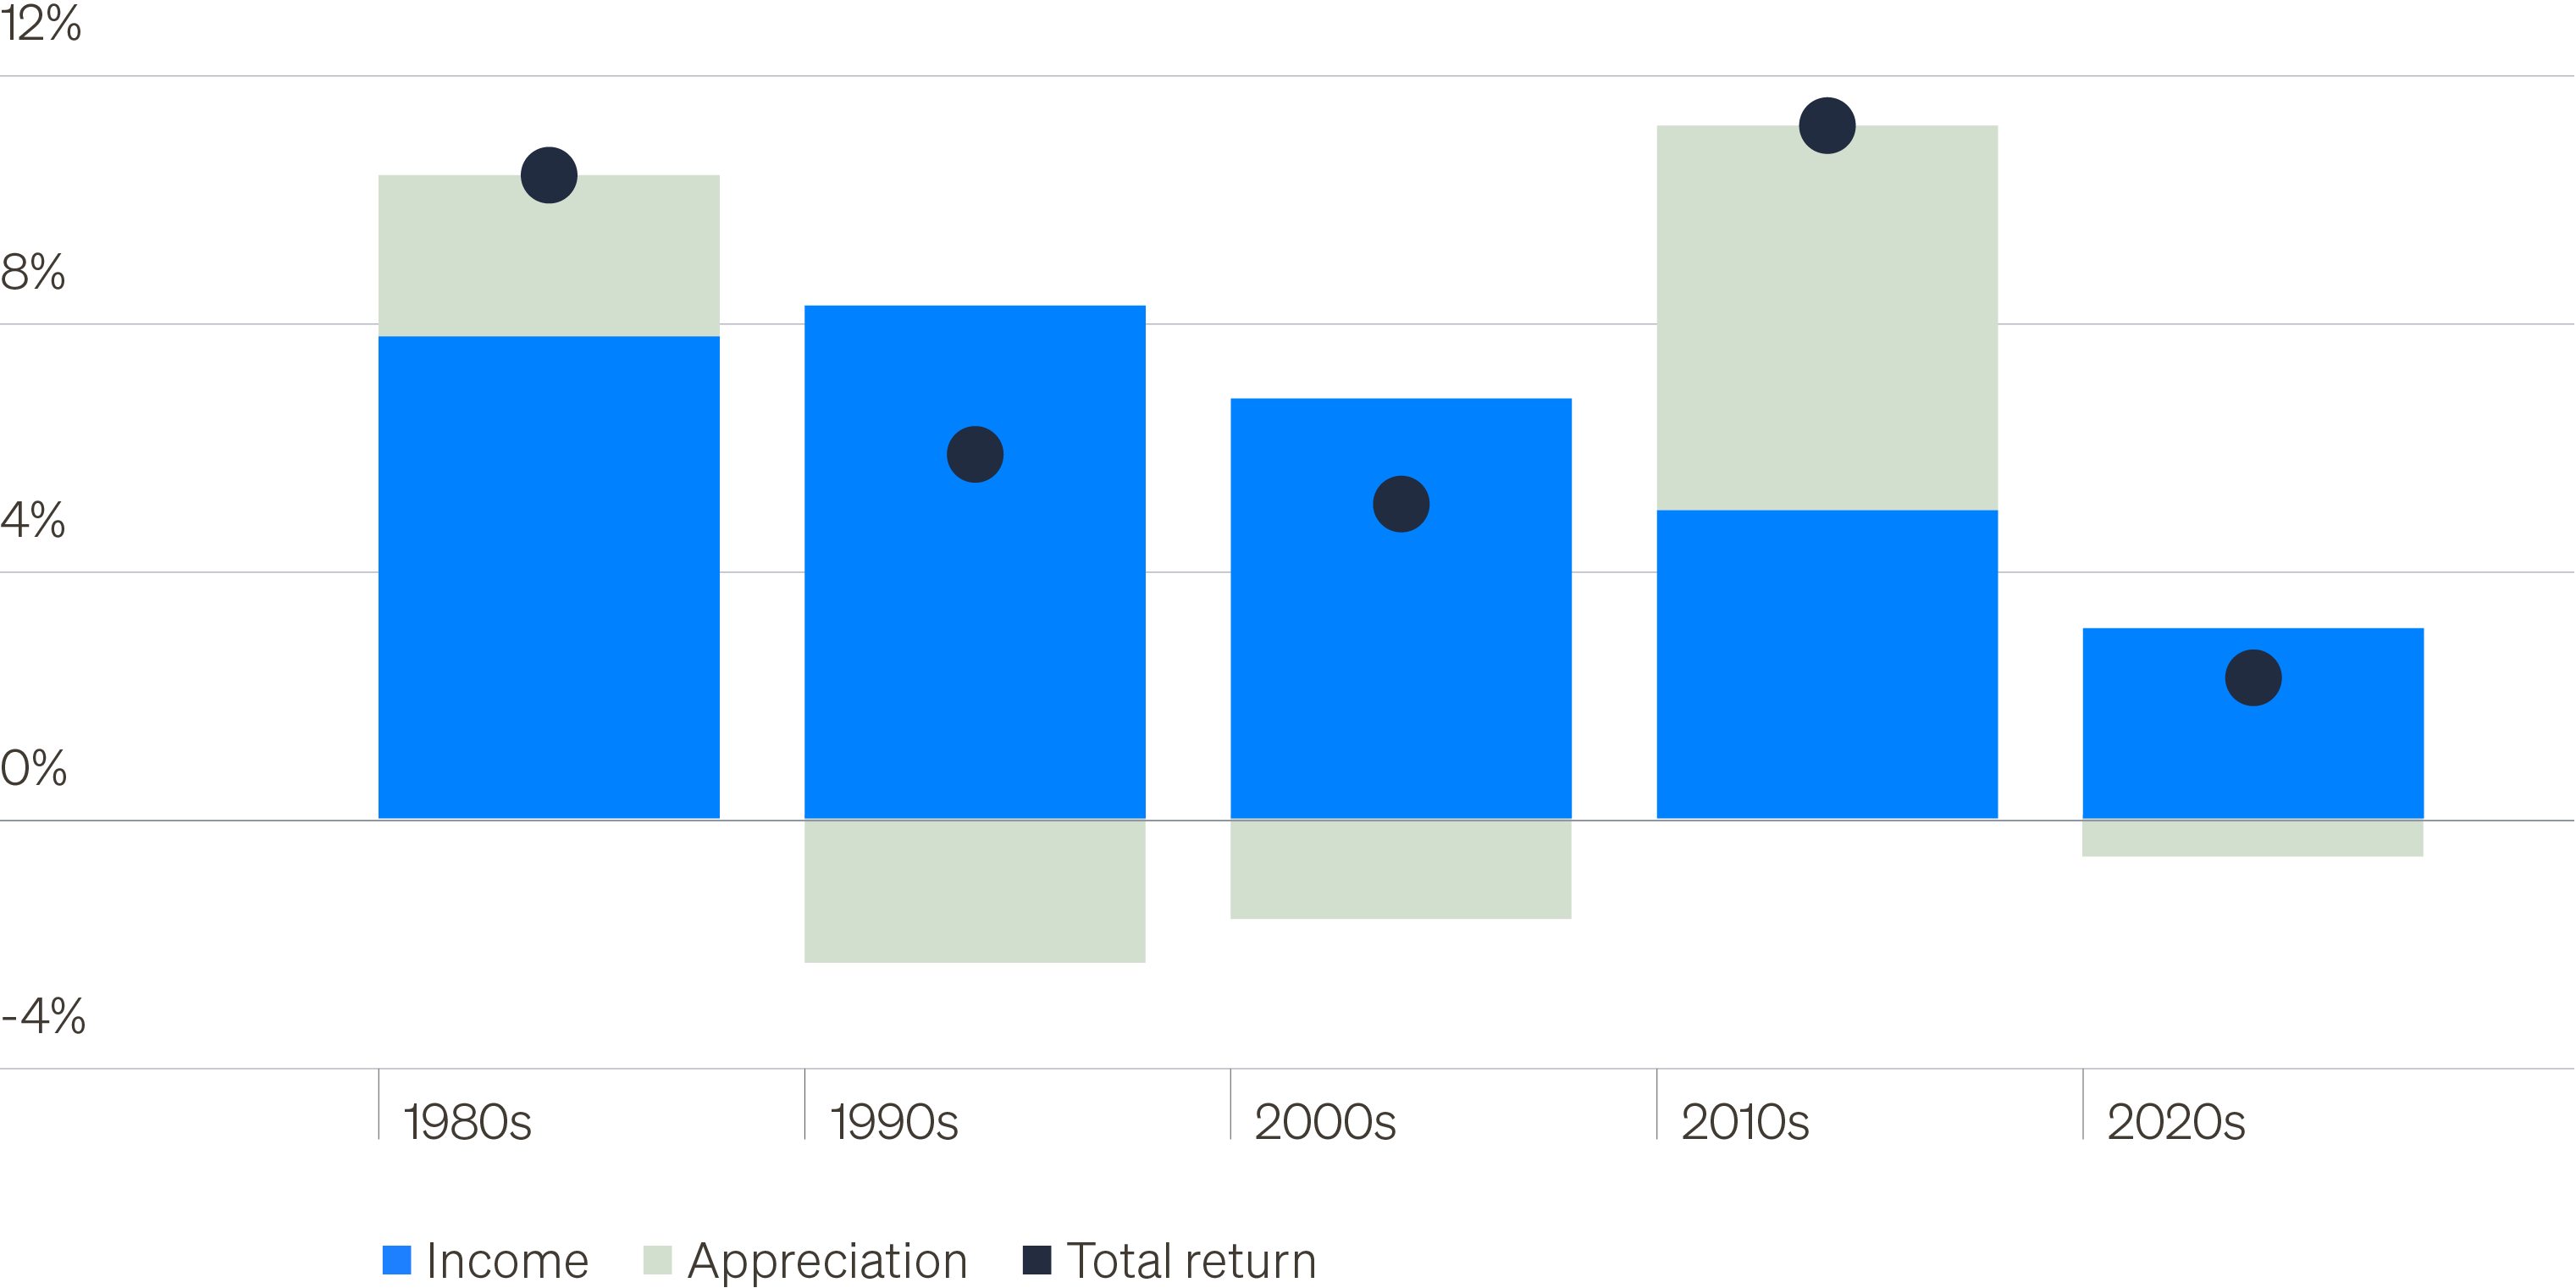
Real estate returns have historically been driven by rental income. During the zero interest rate (ZIRP) era of the 2010s, however, falling interest rates lowered borrowing costs and supported cap rate compression, allowing investors to pay higher prices while maintaining target return profiles. As a result, price appreciation became a more significant driver of CRE returns. As rates normalized in 2022 and 2023, higher financing costs and changing return expectations led property values to adjust lower, making income once again the primary driver of CRE returns.

In this environment, investing higher in the capital structure through CRE debt may offer investors an income-focused approach with greater downside than equity ownership.

Figure 4: Commercial real estate debt returns by decade

Source: NCREIF ODCE Index, as of September 30, 2025.

Current valuations point to modest future equity returns

Cap rates are one of the most commonly used metrics to value income-producing real estate. A property’s cap rate is calculated as its net operating income divided by its market price, and it provides a snapshot of the asset’s current income yield. In general, higher cap rates imply higher potential returns, but they can also reflect higher risk or weaker growth expectations.

Because real estate is an income-oriented investment, investors often compare cap rates to U.S. Treasury yields to assess relative value. The difference between the two, known as the “cap rate spread,” is a key indicator of how attractively real estate is priced over time.

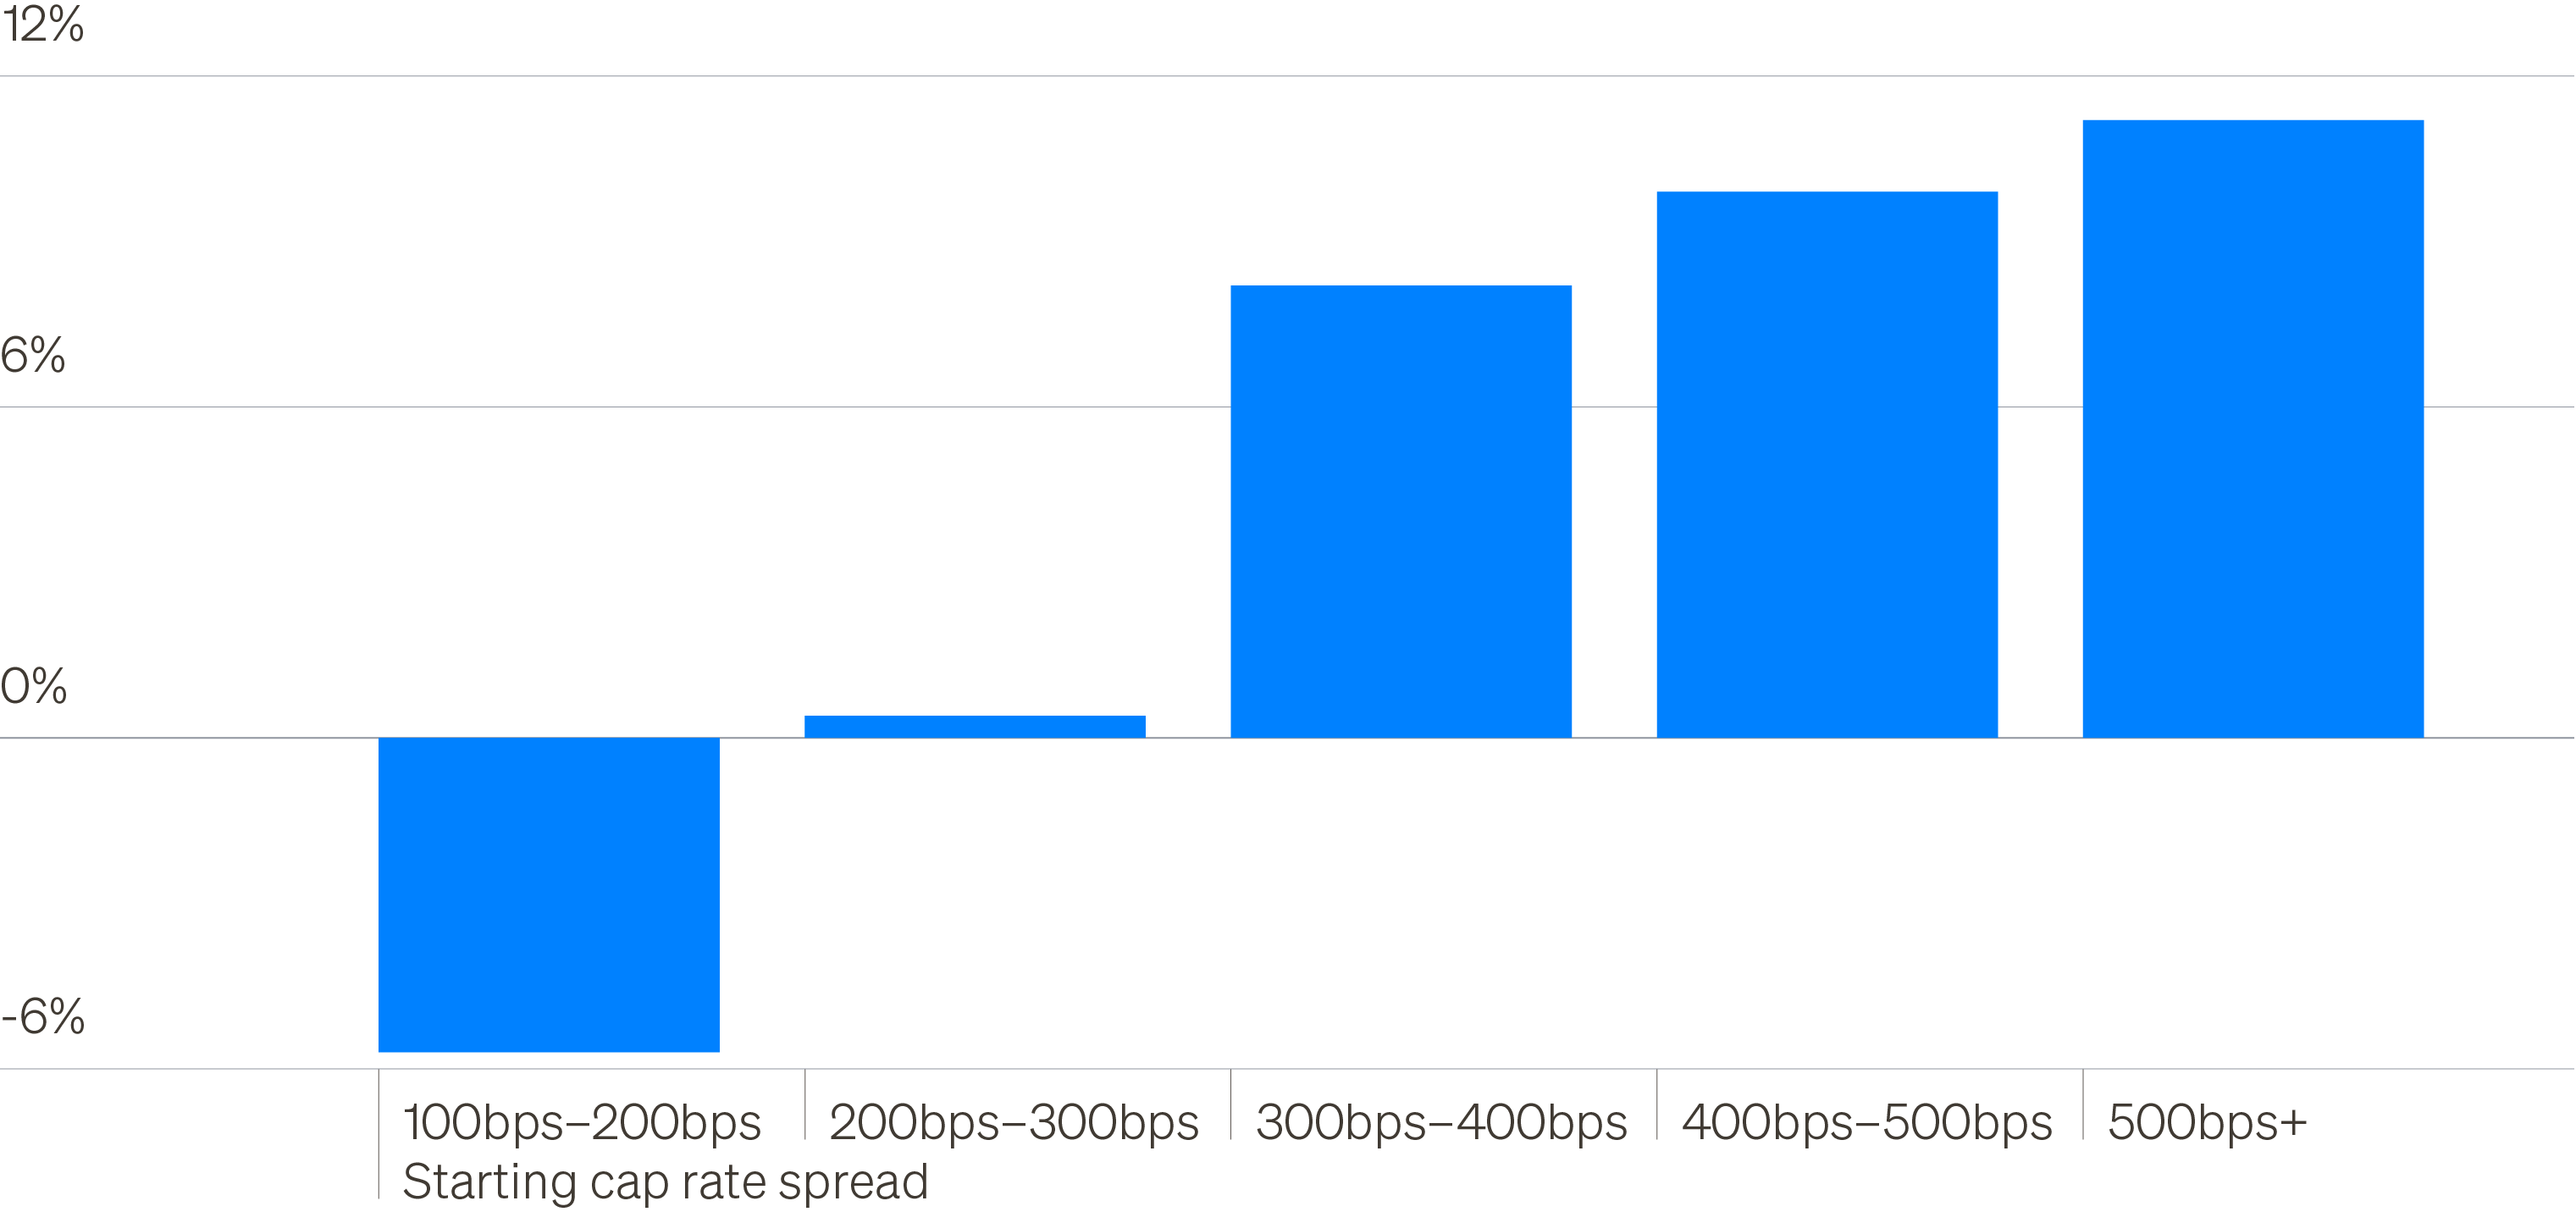
When this spread is narrow, forward returns have historically been more limited, with less upside and greater downside risk. For example, when starting cap rate spreads are in the 200–300 basis point range—as they are today—median forward three-year returns have historically been modest (Figure 5).

This valuation backdrop may make CRE debt especially attractive today, offering investors the potential for steady income and greater downside without relying as heavily on property price appreciation to generate returns.

Figure 5: Median forward 3-year returns (annualized)

Source: MSCI Real Capital Analytics, NCREIF, Future Standard, as of September 30, 2025.

Investing in CRE debt through real estate investment trusts

Real Estate Investment Trusts, or REITs, are one of the most common ways investors gain exposure to real estate. They can offer the potential for diversification, income, and a more accessible, lower‑cost alternative to owning properties directly (equity REITs) or lending directly to property owners (debt REITs).

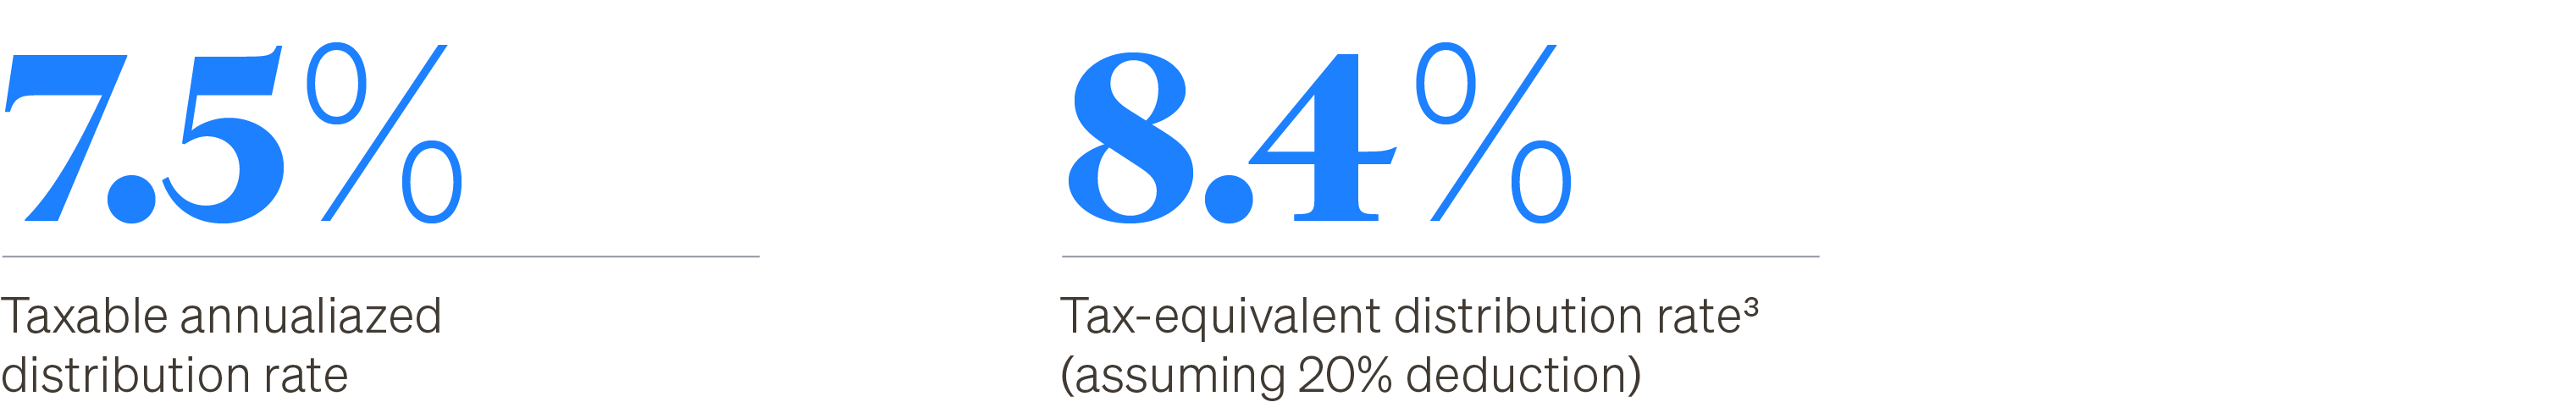
Investors may also benefit from certain tax advantages. Under current tax law, up to 20% of ordinary REIT dividends may qualify for a deduction (excluding capital gain dividends and qualified dividend income), which can lower an investor’s effective tax rate. For example, an investor in the highest tax bracket could see the federal tax rate on ordinary REIT dividends reduced from 37% to 29.6%. This tax benefit is commonly referred to as the Section 199A deduction.

Assuming a REIT pays an annualized distribution rate of 7.5% on a taxable basis, this tax treatment could increase the tax-equivalent rate to approximately 8.4% (Figure 6).

Figure 6: Comparison of REIT distribution rates (assuming 37% tax bracket)*

*For illustrative purposes only. Not indicative of actual or future results.

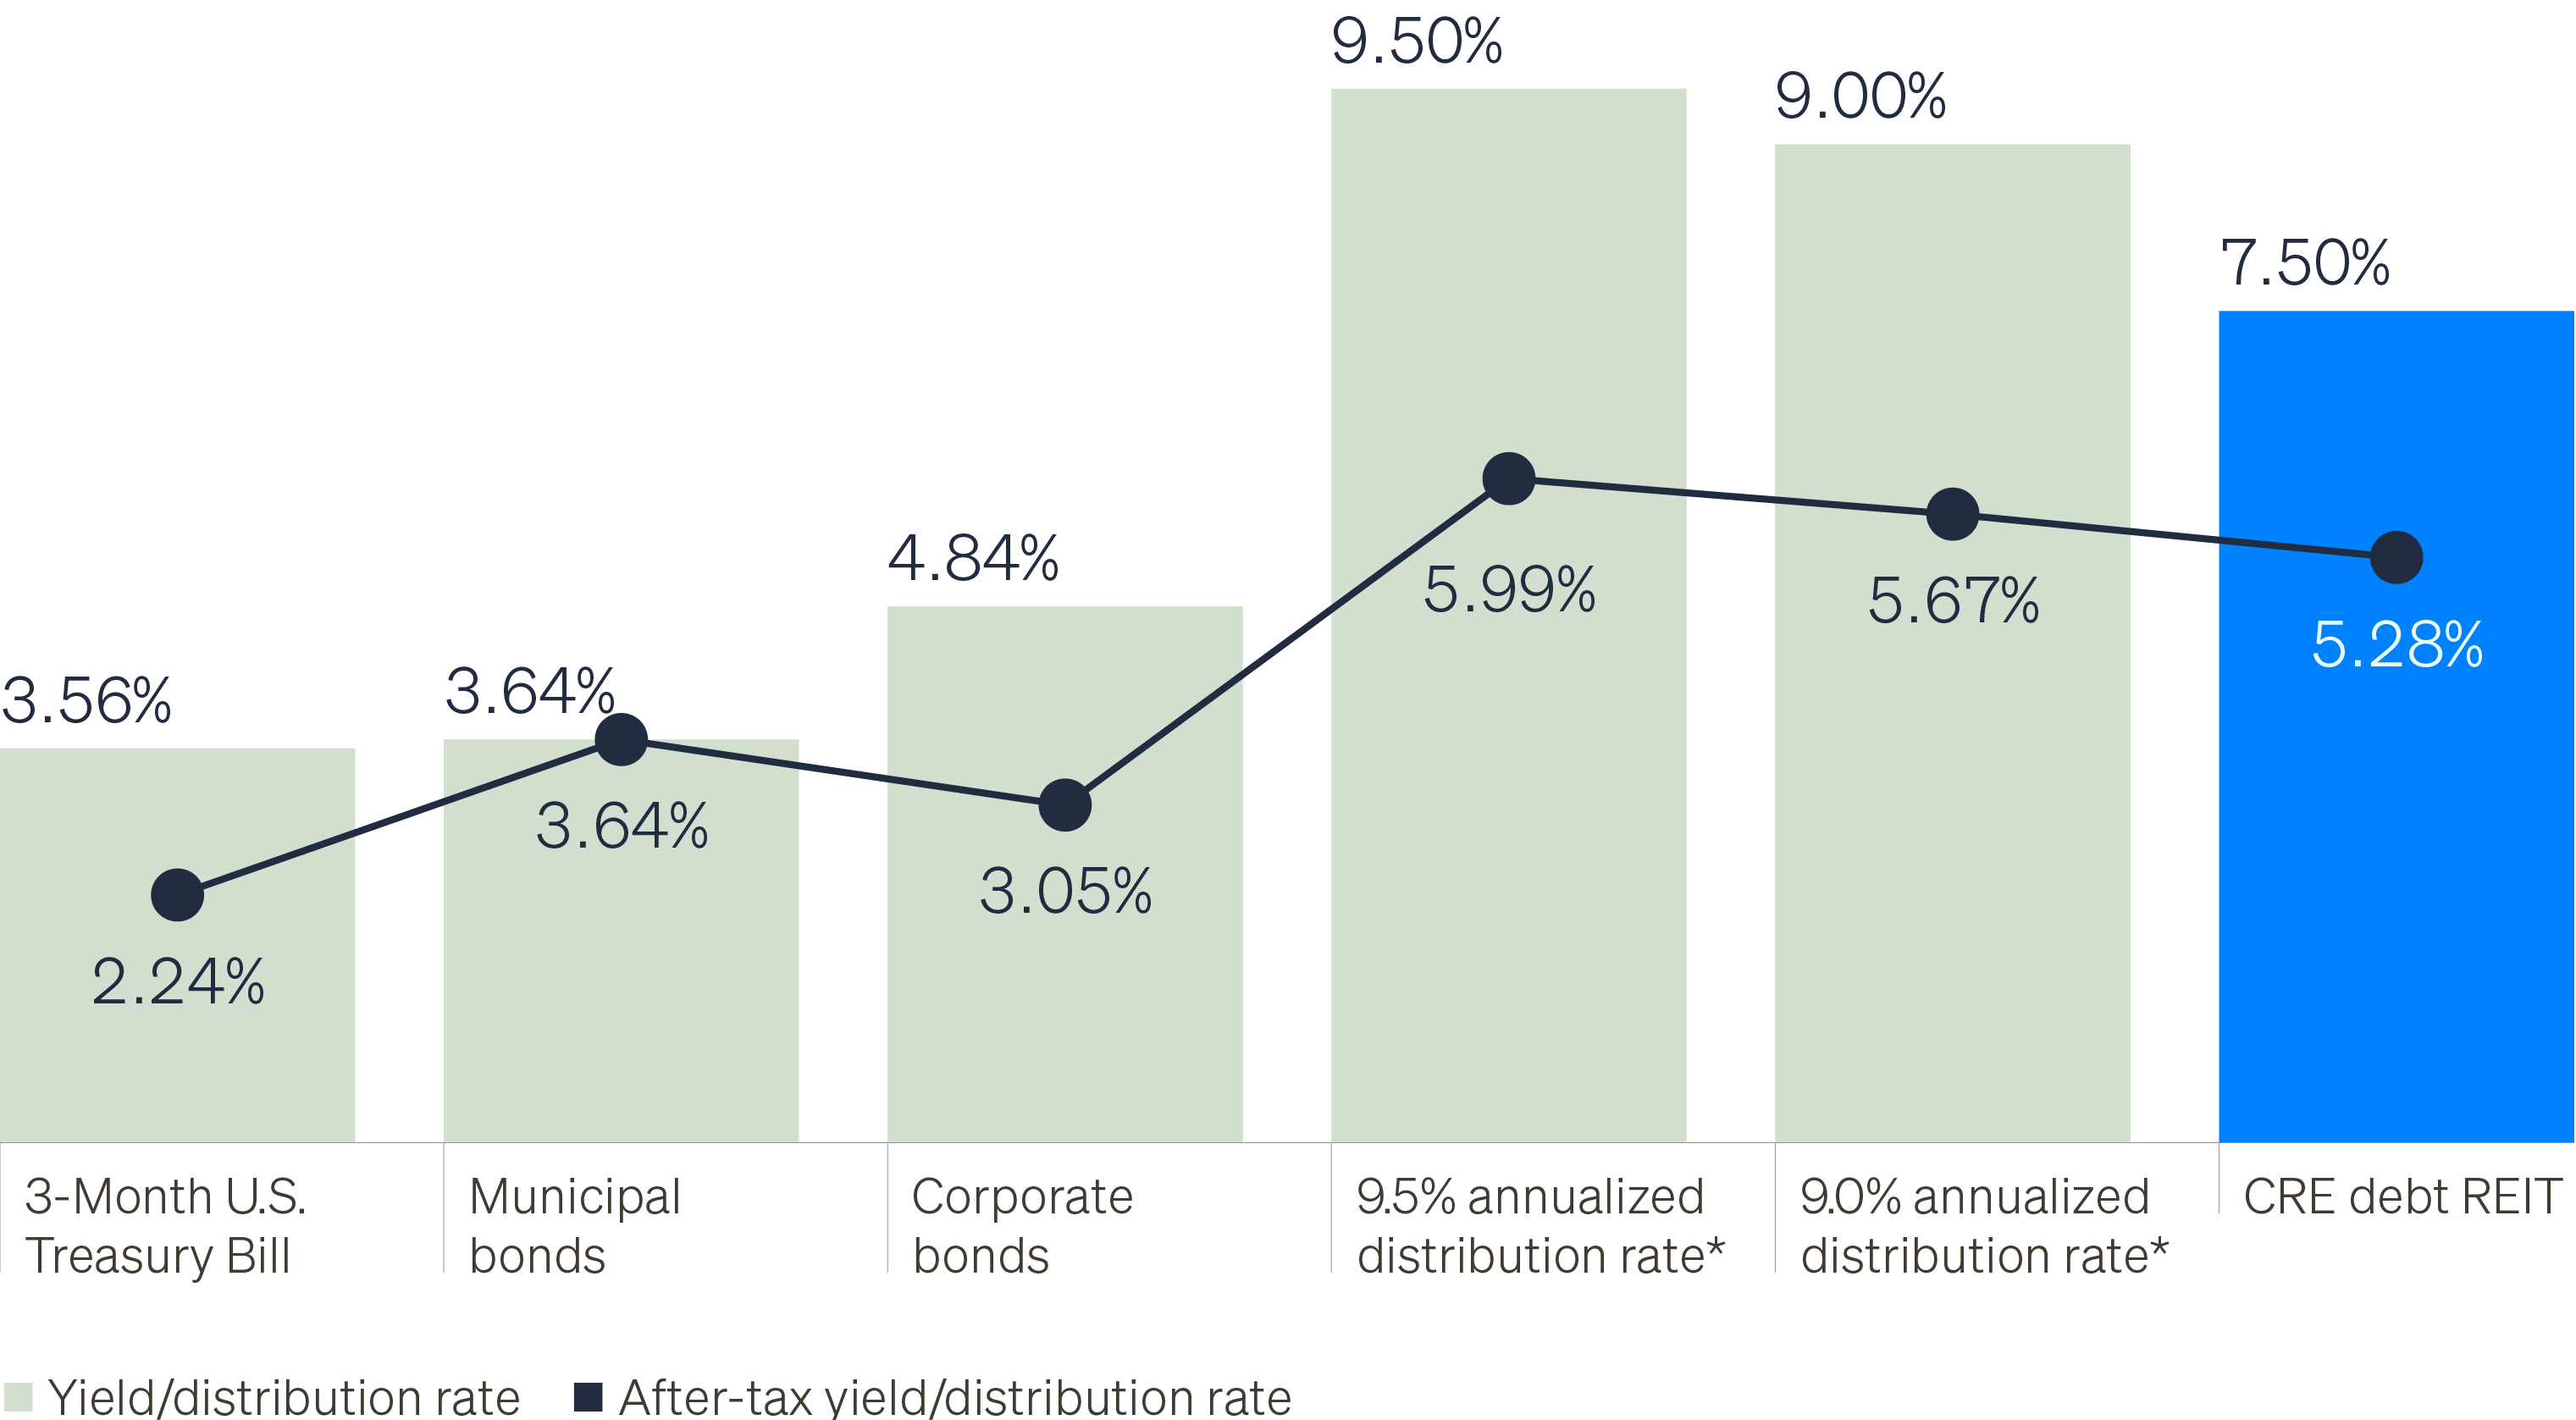
As illustrated in Figure 7, REITs can offer attractive after‑tax income when compared with many traditional fixed income investments, including higher‑yielding taxable investments.

Figure 7: Current and after-tax yields/distribution rates by asset type4

Source: All data as of December 31, 2025, unless otherwise noted. Assumes 37% federal tax bracket. **Taxable investments.

Summary

Commercial real estate debt may offer investors steady income and greater downside protection by investing higher in the capital structure ahead of property owners. In today’s market, where income has reemerged as the primary driver of real estate returns, CRE debt may provide an attractive source of yield and portfolio stability.

INVESTOR CONSIDERATIONS

Commercial real estate and CRE related investments involve a range of risks and considerations that may differ materially from those associated with traditional public market investments. Real estate investments are typically illiquid, and are subject to market, economic, regulatory, and property‑specific risks. There can be no assurance that investment objectives will be achieved, that income will be generated, or that capital will be preserved. Past performance is not indicative of future results. Investments in commercial real estate may be adversely affected by changes in interest rates, capital market conditions, tenant demand, property operating expenses, local and regional economic trends, environmental considerations, and governmental laws and regulations, including zoning, tax, and environmental regulations. Valuations of real estate assets may be based on assumptions and estimates that are inherently uncertain and may not reflect realizable values at the time of sale.

FOOTNOTES
  1. Federal Reserve as of December 31, 2025.
  2. Commercial mortgage loans are illiquid and may not have a secondary market. Consider the key risks before investing. While commercial loans are secured by a first-priority mortgage, they are subject to the risk of default. Although senior loans may be prioritized in payment, as represented in the image, there is no assurance that the valuation of the property that is collateral will be correct, thus, there is risk in investing in senior secured loans.
  3. Taxable-equivalent distribution rate reflects the distribution rate required under the current tax law in order for an investor to receive the same after-tax income under the current tax law. Assumes a 37% tax bracket. The taxable-equivalent yield equals the after-tax yield of a REIT under the new tax law divided by (1 − tax bracket). The after-tax yield equals the distribution rate multiplied by (1 − effective tax rate). The effective tax rate is the product of an investor’s tax bracket and 80%.
  4. Municipal bonds are represented by the S&P Municipal Bond Index. Corporate bonds are represented by the ICE BofA U.S. Corporate Bond Index. Taxable investments may include higher-yielding fixed income investments such as high yield bonds, broadly syndicated loans, business development companies or closed end funds. For 3-month U.S. Treasury bills, corporate bonds and other fully taxable investments, the after-tax yield is calculated as the stated yield x (1-37%). The CRE Debt REIT assumes a 7.5% annualized distribution rate. The after-tax yield reflects the 20% Section 199A deduction appliable to qualified REIT dividends, which reduces the effective tax rate on eligible REIT dividends from 37% to 29.6%. Accordingly, the after-tax yield for the CRE Debt REIT is calculated as the current annualized distribution rate x (1–29.6%). The Section 199A deduction was made permanent under the One Big Beautiful Bill Act in July 2025.
  5. Total AUM estimated as of December 31, 2025.
contributing authors
Michael Ludlow
Michael Ludlow
Head of Research and Fund Communications
footnotes + disclosures

This information is educational in nature and does not constitute a financial promotion, investment advice or an inducement or incitement to participate in any product, offering or investment. Future Standard is not adopting, making a recommendation for or endorsing any investment strategy or particular security. All views, opinions and positions expressed herein are that of the author and do not necessarily reflect the views, opinions or positions of Future Standard. All opinions are subject to change without notice, and you should always obtain current information and perform due diligence before participating in any investment.

Future Standard does not provide legal or tax advice and the information herein should not be considered legal or tax advice. Tax laws and regulations are complex and subject to change, which can materially impact any investment result. Future Standard cannot guarantee that the information herein is accurate, complete, or timely. Future Standard makes no warranties with regard to such information or results obtained by its use, and disclaims any liability arising out of your use of, or any tax position taken in reliance on, such information. Any projections, forecasts and estimates contained herein are based upon certain assumptions that the author considers reasonable.

Projections are necessarily speculative in nature, and it can be expected that some or all of the assumptions underlying the projections will not materialize or will vary significantly from actual results. The inclusion of projections herein should not be regarded as a representation or guarantee regarding the reliability, accuracy or completeness of the information contained herein, and neither Future Standard nor the author are under any obligation to update or keep current such information. All investing is subject to risk, including the possible loss of the money you invest.