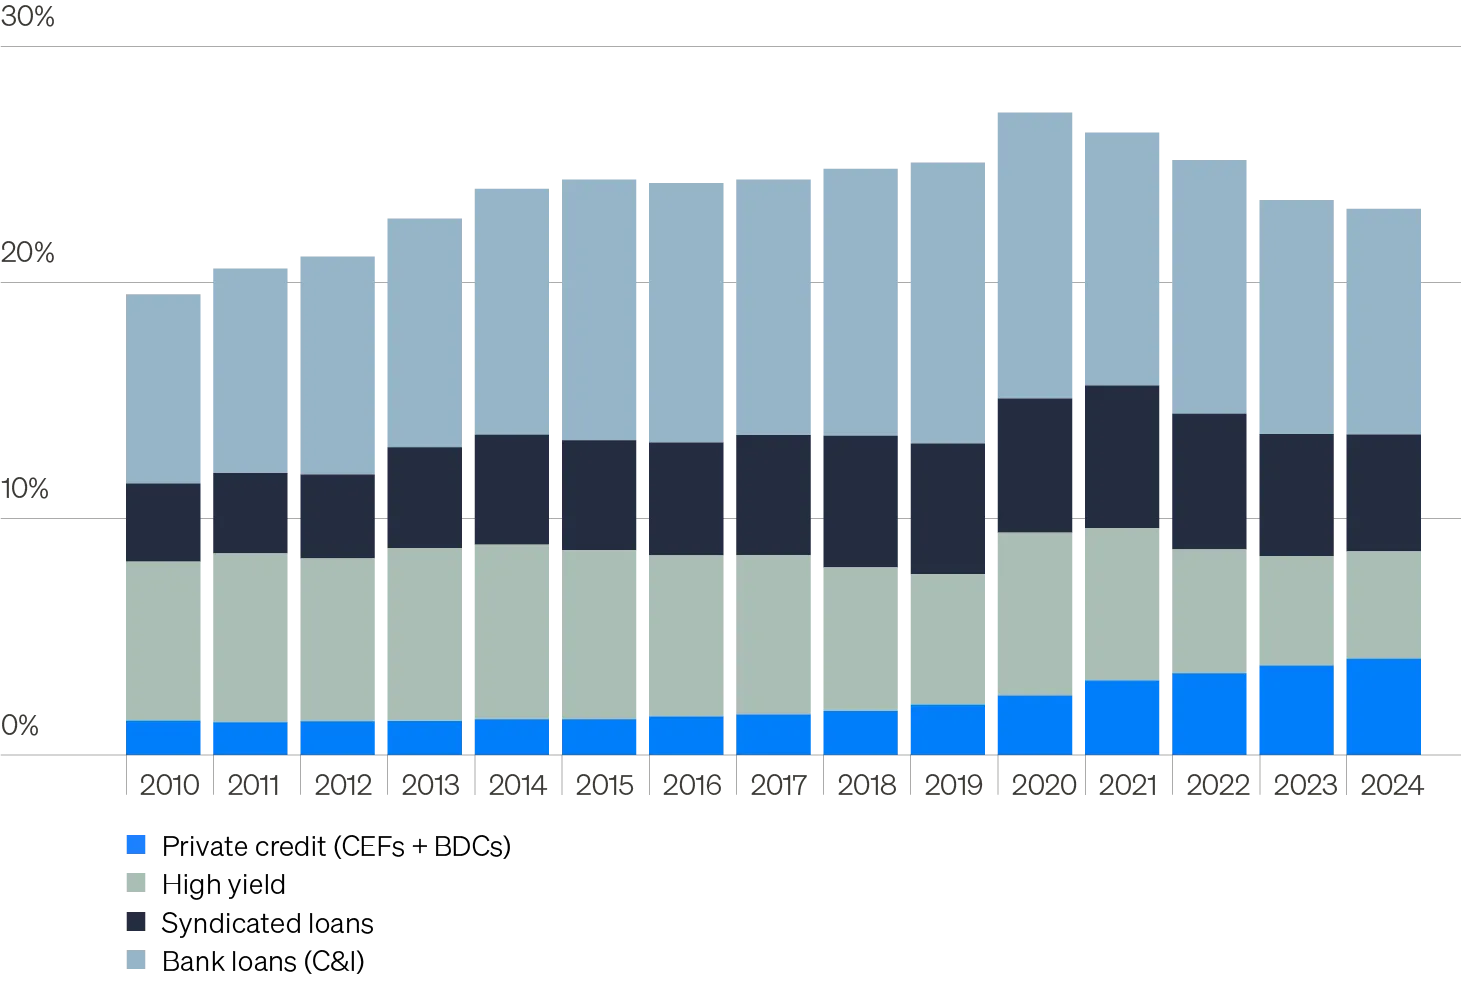
- Federal Reserve, U.S. Bureau of Economic Analysis, Preqin, Future Standard, as of year-end 2024.
- Cliffwater Direct Lending Index. Data as of June 30, 2025.
The chart of the week and any accompanying data is for informational purposes only and shall not be considered an investment recommendation or promotion of Future Standard or any Future Standard fund. The chart of the week is subject to change at any time based on market or other conditions, and Future Standard and FS Investment Solutions, LLC disclaim any responsibility to update such market commentary. The chart of the week should not be relied on as investment advice, and because investment decisions for the Future Standard funds are based on numerous factors, may not be relied on as an indication of the investment intent of any Future Standard fund. None of Future Standard, its funds, FS Investment Solutions, LLC or their respective affiliates can be held responsible for any direct or incidental loss incurred as a result of any reliance on the chart of the week or other opinions expressed therein. Any discussion of past performance should not be used as an indicator of future results.
This information is educational in nature and does not constitute a financial promotion, investment advice or an inducement or incitement to participate in any product, offering or investment. Future Standard is not adopting, making a recommendation for or endorsing any investment strategy or particular security. All views, opinions and positions expressed herein are that of the author and do not necessarily reflect the views, opinions or positions of Future Standard. All opinions are subject to change without notice, and you should always obtain current information and perform due diligence before participating in any investment. Future Standard does not provide legal or tax advice and the information herein should not be considered legal or tax advice. Tax laws and regulations are complex and subject to change, which can materially impact any investment result. Future Standard cannot guarantee that the information herein is accurate, complete, or timely. Future Standard makes no warranties with regard to such information or results obtained by its use, and disclaims any liability arising out of your use of, or any tax position taken in reliance on, such information.
Any projections, forecasts and estimates contained herein are based upon certain assumptions that the author considers reasonable. Projections are necessarily speculative in nature, and it can be expected that some or all of the assumptions underlying the projections will not materialize or will vary significantly from actual results. The inclusion of projections herein should not be regarded as a representation or guarantee regarding the reliability, accuracy or completeness of the information contained herein, and neither Future Standard nor the author are under any obligation to update or keep current such information.
All investing is subject to risk, including the possible loss of the money you invest.