It’s GARP time
After releasing our perspective on middle market private equity secondaries about one month ago, we continue to believe the opportunity in certain areas of PE secondaries continues to be attractive. However, the core investment thesis for middle market PE is that it continues to be a primary example of growth at a reasonable price (GARP) in an investment universe mainly devoid of it. Whether you are investing in PE primaries, co-investments or secondaries and accessing middle market PE via an evergreen or drawdown vehicle, the asset class investment thesis doesn’t start and end with GARP. There is certainly ample room for an experienced asset manager to add value/alpha above and beyond the asset class performance. However, the level of GARP present in the asset class alone dramatically raises the probability of a successful short-, medium- and long-term investment outcome. So, without further ado, let’s reexamine the middle market PE GARP thesis in all of its wonderful glory!
Middle market private equity: The definition of GARP
Remember, the entire point of investing in the equity part of the capital structure in corporations, real estate or infrastructure/real assets is for growth. To achieve growth in enterprise value, earnings, net operating income, etc., you need to start by achieving attractive revenue growth. So, let’s see how different sections of U.S. and global equity markets have been stacking up recently (the last 12 reported months).
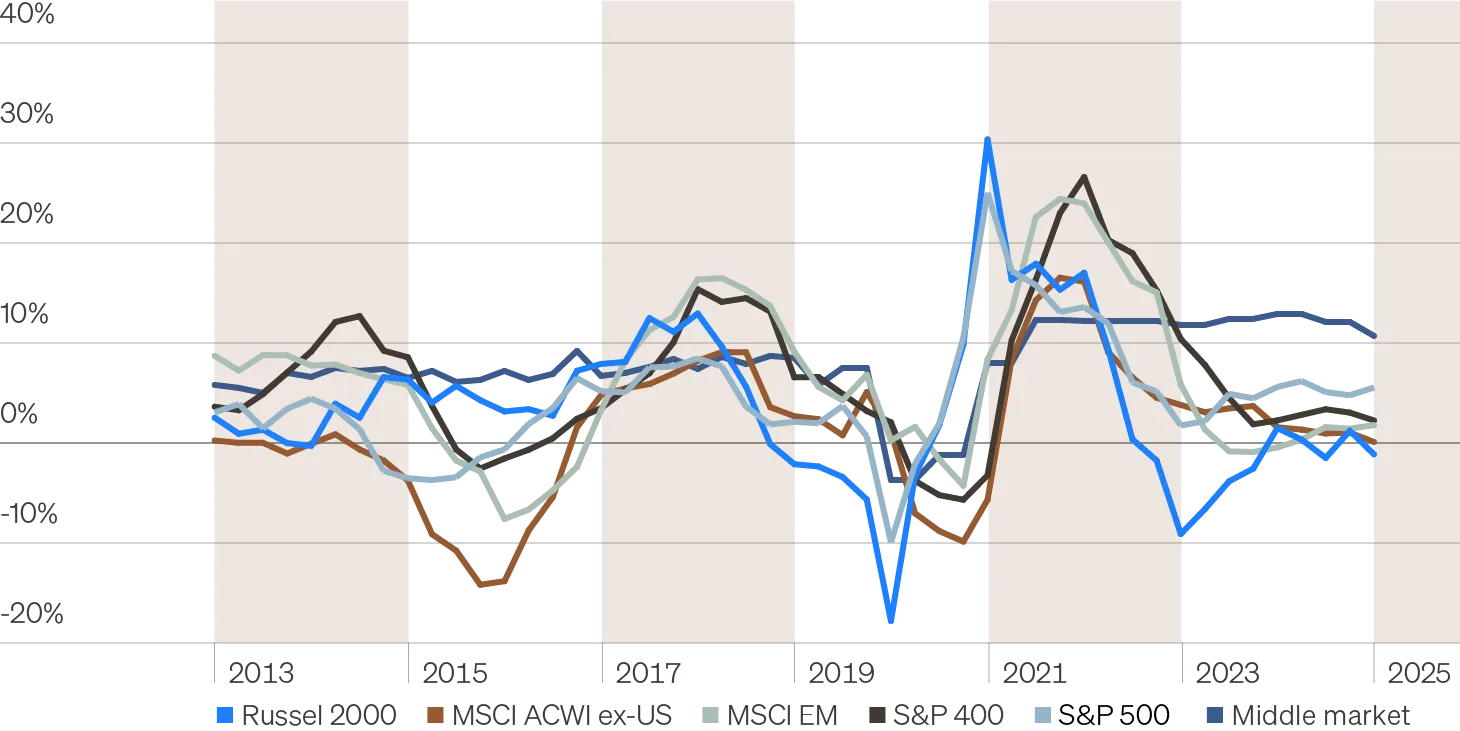
As you can see from the following chart (“Trailing 12-month revenue growth”), it sort of looks like:
- The S&P 500 shows a reasonable, slightly better-than-nominal GDP-like growth of 5.5% (thank goodness for U.S.secular tech growth).
- The Russell 2000 (RUT) exhibits continued paltry revenue growth of NEGATIVE 1.2% (no surprise given the RUT has been an adverse selection bias index for quite some time). Rarely is “paltry”considered a compliment, but when an equity index exhibits negative revenue growth during a robust economic expansion, paltry may indeed be too kind.
- U.S. mid-cap revenue growth falls somewhere in between the S&P 500 and the RUT as one would expect.
What continues to be remarkable in a positive global growth environment is the continued outright revenue declines in non-U.S. global markets and emerging markets. Heck, sometimes earnings can be underwhelming for reasons outside of management control in a transitional environment (here’s looking at you, tariffs)—but revenue?
In stark contrast, the recent run of rather remarkably strong revenue growth for privately held U.S. middle market corporations at the asset class level has continued…without any additional alpha!
Trailing 12-month revenue growth (%)

Lest one believe this is just a recent phenomenon, you can see from the following chart (“Greater opportunity for growth in middle market”) that revenue growth outperformance of U.S. middle market corporations relative to the S&P 500, U.S. mid-cap, the Russell 2000, non-U.S. global and emerging markets have been fairly consistent over time. So you have received substantially better revenue growth in middle market corporations than publicly traded markets other than the NASDAQ for most of the last 10 years. (As a reminder, the G in GARP stands for growth…so far so good.)
Greater opportunity for growth in middle market
Complementing U.S. small cap, large- and mega-cap growth
When we laser-focus on middle market PE vs. the Russell 2000, one of the remarkable attributes of the RUT (both irregular and surprising to many) is that over 40% of the companies in the index have not made money during a robust and relatively stable economic expansion of roughly 5% nominal gross domestic product (GDP) growth. As you can see from the first chart below (“Share of Russell 2000 with negative earnings”), the trend of a higher and higher concentration of unprofitable companies in the RUT has been present for around 20 years now.
Over time, many GARPy companies that had been present in the RUT either graduated (grew) their way into U.S. mid-cap, were acquired or merged with a competitor, or were taken private. So part of the issue with the narrowness of markets (more and more market concentration in top five, six and ten companies)and the lack of profitability for over 40% of the RUT has been the mega trend of more and more companies remaining or staying private as vividly shown in the second chart (“% change in U.S. public and private companies”). So when I say the term “adverse selection bias index” for the RUT, you know what I’m talking about!
Unsurprisingly, this has led to arguably the number one use case for middle market PE: Replacing or complementing U.S. small cap—or alternatively, replacing U.S. small cap and complementing U.S. large and mega cap growth.
Share of Russell 2000 with negative earnings
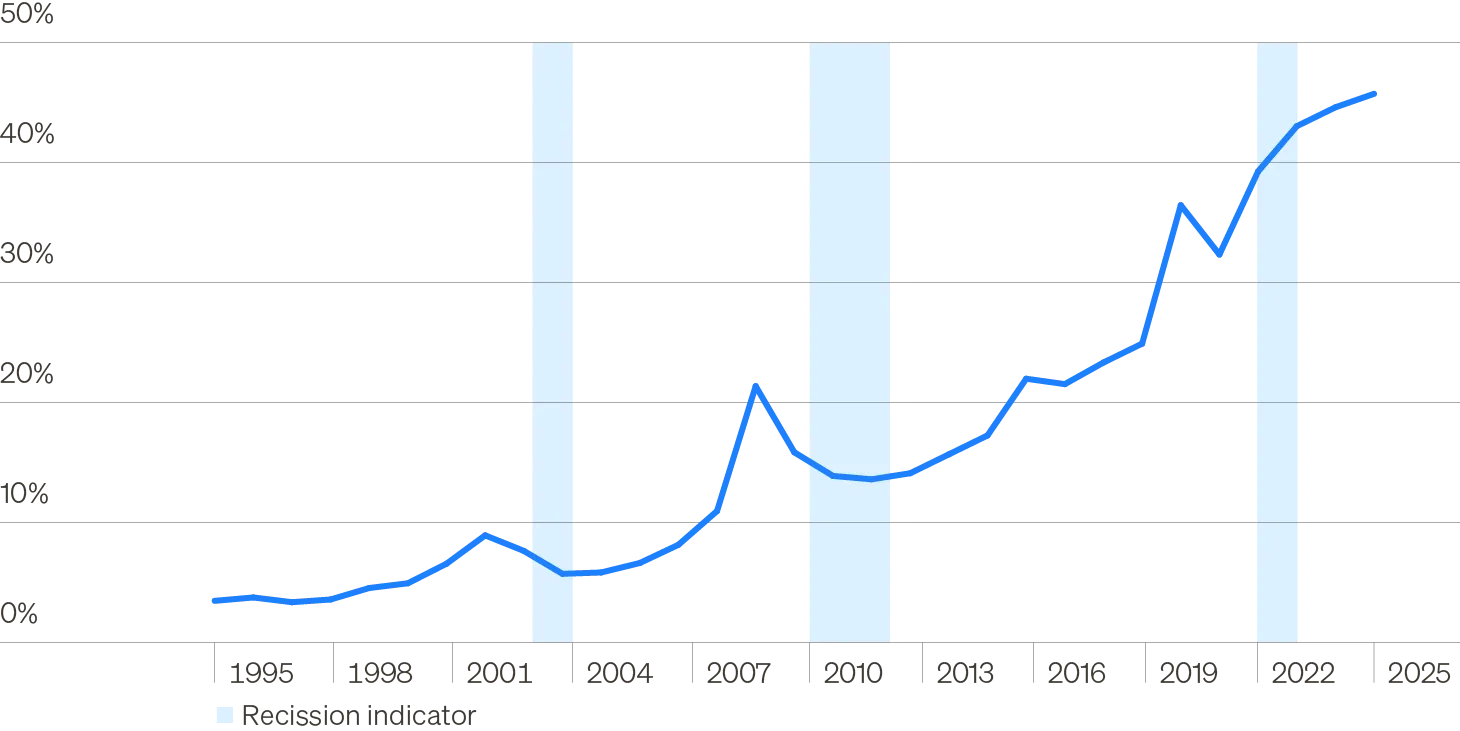
% change in U.S. public and private companies1,2

1. U.S. Census Bureau; U.S.-based private companies with more than 100 employees for years 1992–2022.
2. World Bank; U.S.-based listed companies for years 1992–2022.
Middle market PE for growth
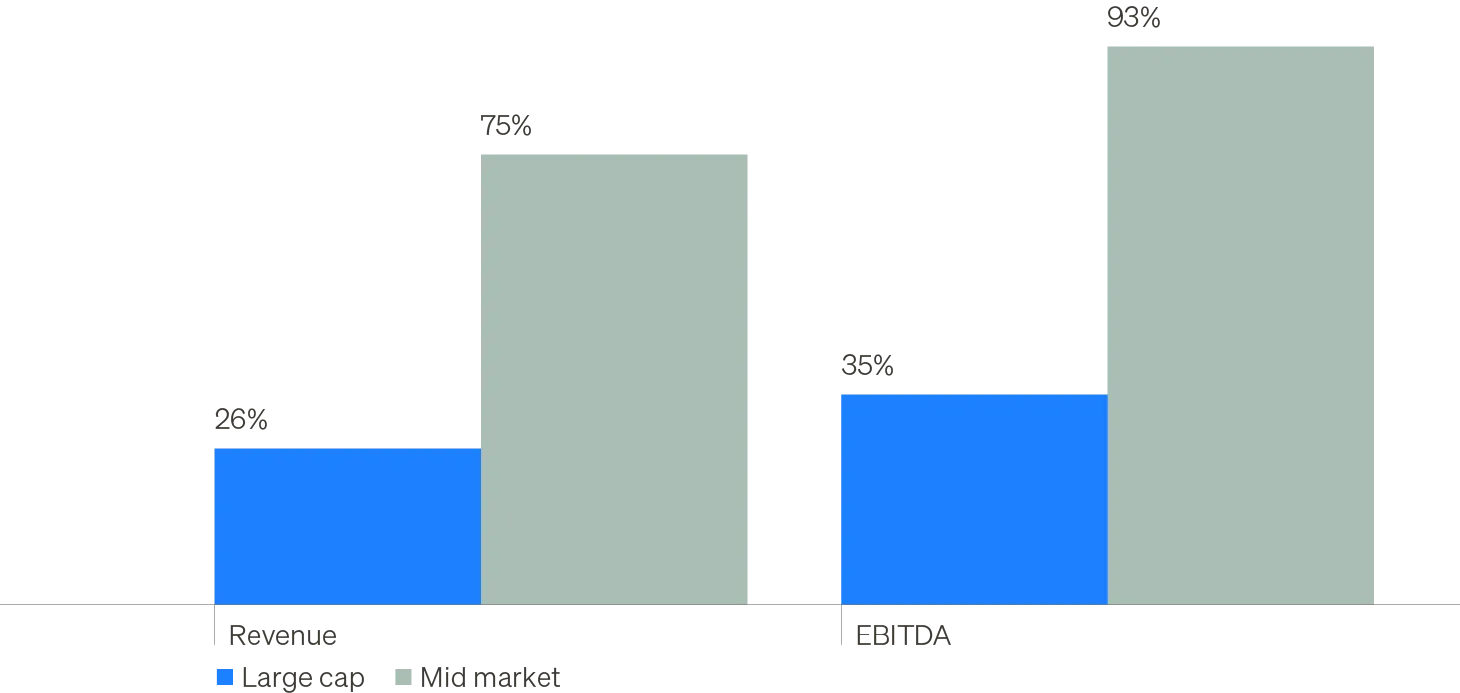
When we turn our attention to the G in GARP for middle market PE relative to large and mega cap PE (where the vast majority of institutional and individual investor dollars flow), we once again see substantial outperformance. This is once again a subtle reminder that one must be more discerning in selecting alternative strategies to embrace these days.Middle market revenue and EBITDA growth have clearly trounced large and mega cap PE quite handily over time…so far so great for the G in GARP!
Weighted average changes from sponsor entry to exit

So I think we’ve demonstrated that if you want that G for growth in GARP, U.S. middle markets are the place to be! This assumes, of course, you are no longer buying the disastrous post-lost decade investment consensus on emerging markets. Why disastrous? It doesn’t offer that great of economic growth anymore, strong economic growth does not necessarily lead to investment performance, and only one of the BRICS countries remains investable (India) and that has been expensive for quite sometime.
The ARP in GARP
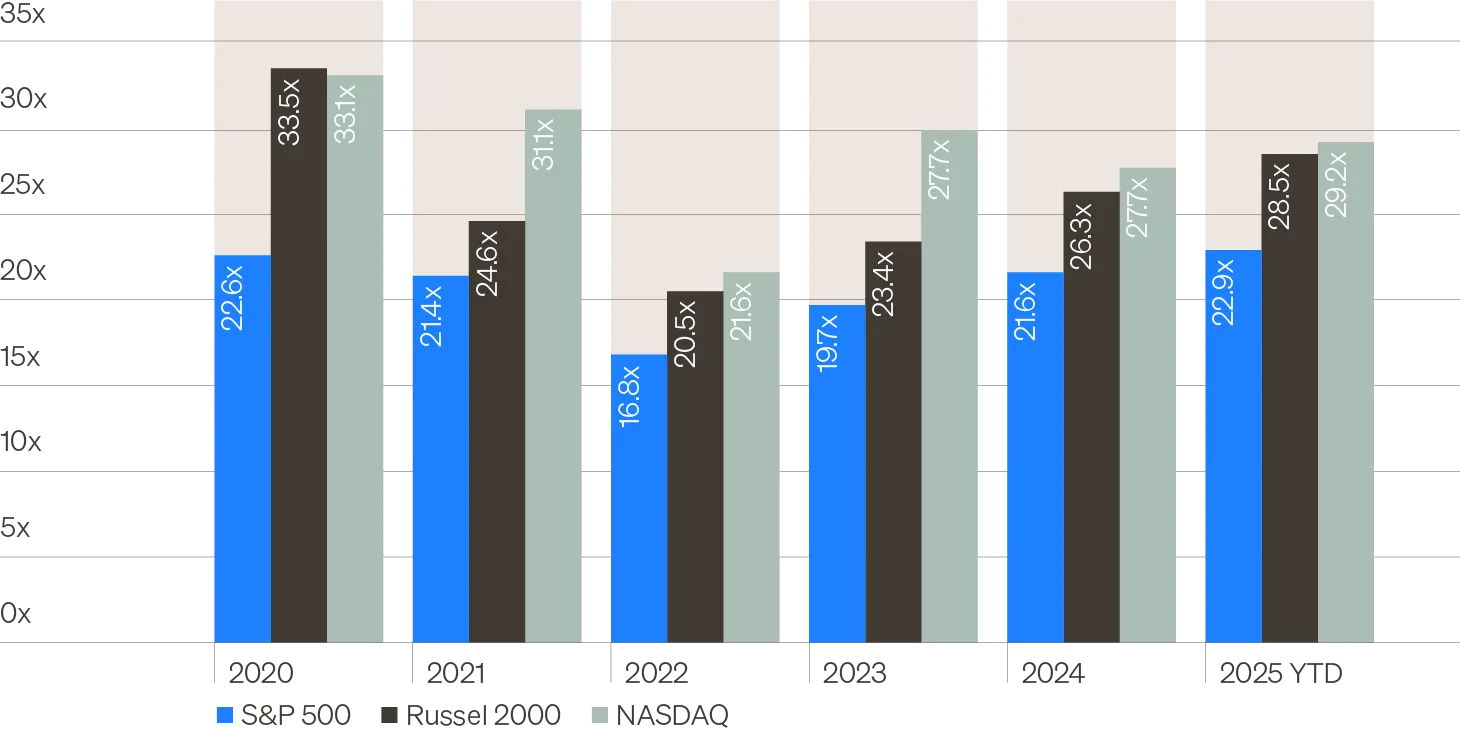
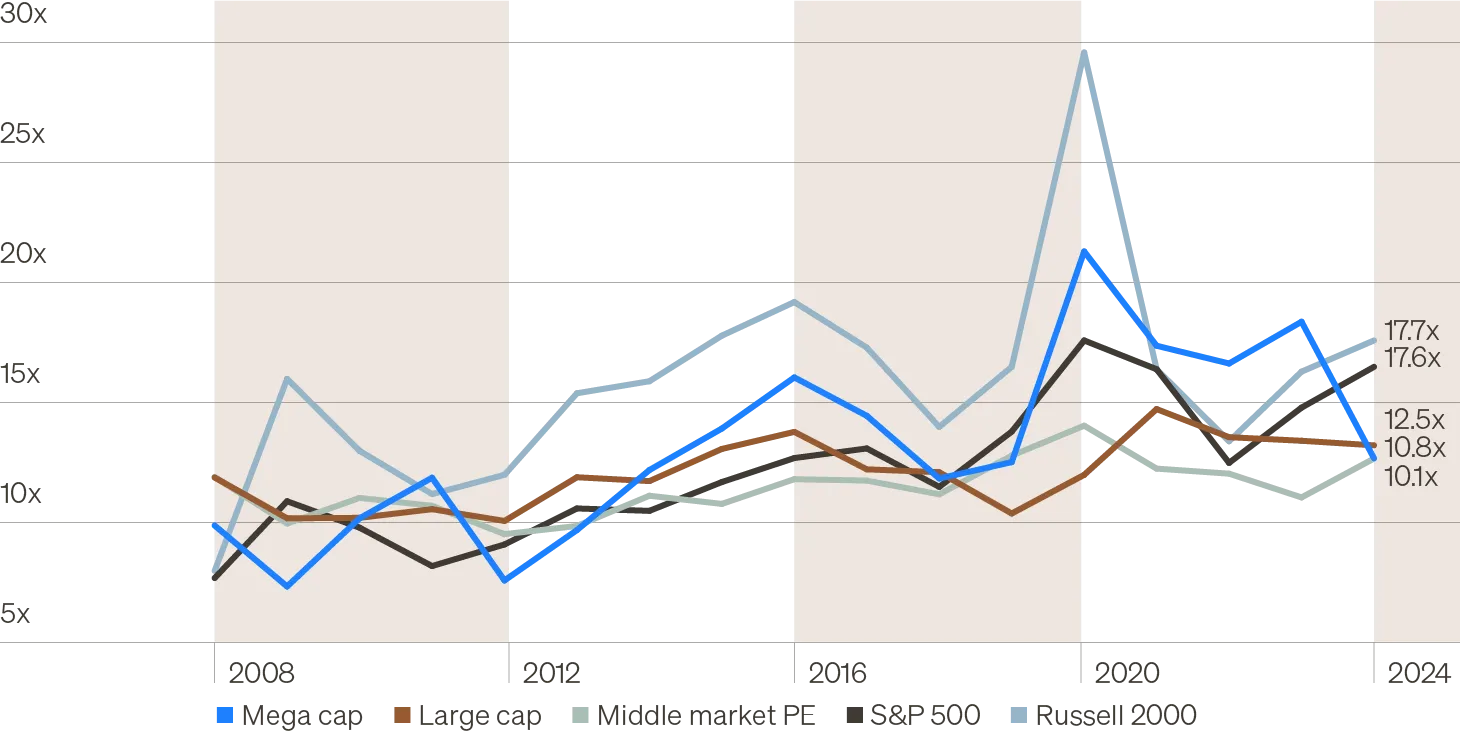
Now, turning our attention to “at reasonable price,” as you can see from the chart below (“12-month forward P/E ratio”), public equity markets are for the most part back to trading close to or above 2021 valuations.
- The S&P 500 is at 22.9X times forward earnings (7% more expensive than 2021).
- The Nasdaq is at 29.2X (actually 6% cheaper than 2021).
- The Russell 2000 is at a staggering close to 28.5X forward earnings (almost 16% more expensive than 2021).
12-month forward P/E ratio
As you can see from the next chart (“Median PE EV/EBITDA (Global)”) and in stark contrast to the S&P 500 and Russell 2000, private market transaction valuations are materially cheaper than 2021 across the board by 17% or greater. Furthermore, when we normalize all markets to enterprise value/EBITDA (remember, private markets are always quoted in EV/EBITDA terms and public markets are market cap value aka price/earnings (P/E) or market cap value aka price/free cash flow (P/FCF)), you clearly see the dramatic expansion of the valuation spread between public markets vs. private market transactions.
Median PE EV/EBITDA (Global)
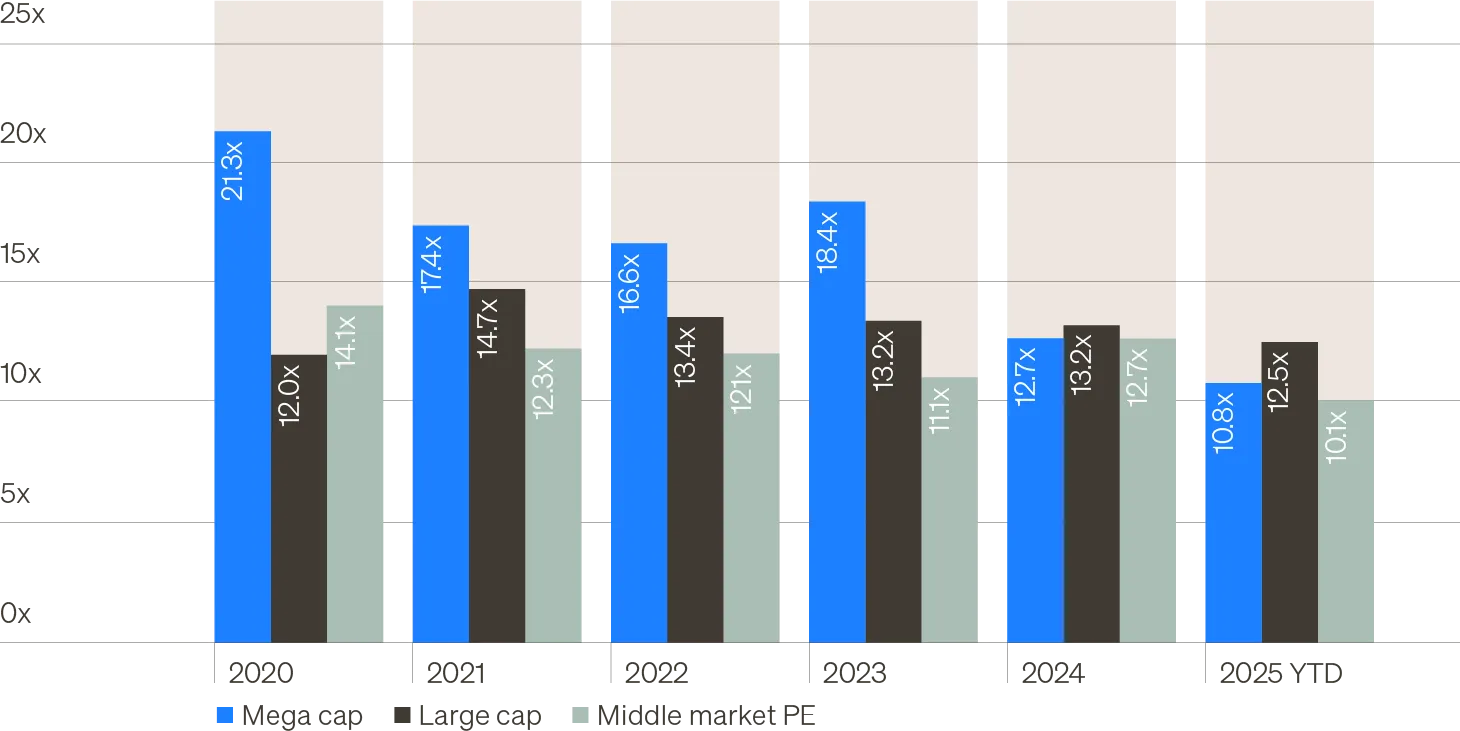
EV/EBITDA for public markets vs. private markets
The most dramatic example of this is the Russell 2000 trades at 17.7 EV/EBITDA vs. 10.1 for the private middle market. However, from an asset allocation and investment standpoint, the Russell 2000 (an index where 40%+ of the companies were unprofitable from Q4 of 2022 through Q4 of 2024, and trailing 12-months (TTM) revenue growth has been an uninspiring 2.4%) is trading at an over 90% valuation premium relative to TTM U.S. middle market private equity transactions through Q1 of 2025 when middle market PE has grown revenue by almost 10.7% from in 2024. This is arguably the greatest market inefficiency present today in markets. If you can sacrifice the liquidity of listed equities, you can own an asset class with 4.5X the revenue growth at a 48% discount! Double holy cow!
Structural features of middle markets: Adding alpha
Now that we’ve established middle market PE as an asset class stands out like an oasis of GARP in a relatively GARP-less world, let’s turn our attention to some of the structural features of the private middle markets that create a fertile environment for adding alpha above and beyond the attractive beta of middle market private corporations.
One of the first attributes of the U.S. middle market private corporations that literally jumps off the page is the sheer vastness of it. Approximately 200,000 private corporations with between $10 million and $1 billion of revenue make up approximately one-third of private sector GDP or a little under $9 trillion in size.
Let me repeat, U.S. middle market private corporations generate approximately $9 trillion in nominal economic output!
This would make middle market private corporations the third-largest economy in the world. So if you were ranking global economies, the list would be the U.S., China, U.S. middle market private corporations. Then at roughly half the size or less of the sector would be Germany, India and Japan in a horse race for numbers four, five and six (despite anemic growth at best—recently Germany has put some distance between itself and Japan but it’s only a matter of time before India surpasses Germany). Taking the numbers one step further, U.S. middle market private corporations have over 2.1x the economic output/revenue of the entire Indian economy.
Now we’re certainly not going to argue every middle market private corporation is a great company you want to invest in. However, from an alpha generation standpoint, it should be fairly obvious that with hundreds of thousands of companies to analyze and choose from, an experienced asset manager can potentially add far more alpha than only within the approximately 4,600 listed companies in the U.S. today and the 2,000 companies in the RUT.
Why business owner clients care
The other key point to make for middle market private corporations (and in turn middle market private equity) is how this sector represents a key development in the history of generating wealth in the U.S.over decades and even centuries.
First through fifth generation owner-operated businesses have been a key wealth generator for families over time. Once the wealth was created, the liquidity events for the families would historically come from initial public offerings (IPOs) or strategic acquisitions by larger corporate entities. More recently, with the rise of PE AUM and the decline in IPOs for non-hypergrowthy tech businesses, the liquidity events tend to be either bringing in private capital or strategic acquisitions by larger corporate entities. What’s so fascinating about this history and evolution of wealth generation and then liquidity events is that until the creation of evergreen Regulated Investment Company (RIC) vehicles investing in middle market private corporations (middle market private equity), even though a family created their wealth by successfully growing a small or medium-sized business, it was virtually impossible to compound the wealth in a diversified portfolio of similar sized businesses after selling the business. Hey, who said innovation only takes place in technology or health care…every now and again we also innovate in asset management, too.
It should in turn come as no surprise that middle market private equity as a strategy for compounding wealth in a tax-efficient manner resonates with investors that generated their wealth in the same manner.
Additional structural advantages
In terms of additional structural advantages of middle market PE beyond just the sheer scale, breadth and depth of corporate entities, let’s turn our attention to the following attributes.
Approximately 40% cheaper entry point valuation than large and mega cap PE
As many of you have heard me say, I’ll be the first to tell investors that a $25 middle market EBITDA company should be cheaper than a $500 middle market EBITDA company, which in turn should be materially cheaper than NVIDIA. However, entering at a lower valuation leads to a much higher probability of exiting at a higher valuation after successfully improving the growth, size, scale and operating efficiency of a smaller business. Buy cheap growth earnings north of 15% for three to seven years, and sell less cheap—that is middle market PE in a nutshell.
A little below 40% less leverage than large and mega cap PE
One of the key benefits of having less balance sheet leverage for any company regardless of size is it lowers the risk of bankruptcy or the need to raise additional dilutive equity capital in the event that something goes wrong—who knew, sometimes things go wrong in the economy, a sector and industry or just temporarily in an individual company. This concept is elementary. However, one of the least appreciated aspects of less balance sheet leverage (even at slightly higher borrowing costs) is that less of a company’s precious free cash flow is diverted to service debt and more of that precious free cash flow can be invested into growth, which is kind of the whole point of the strategy (the G in GARP).
Middle market characteristics have driven outperformance

2. Pitchbook: Average leverage at entry during the period of 2017–2023 for transactions above and below $500 million of TEV; net leverage of 4.9x EBITDA for transactions below $500 million TEV and net leverage of 7.7x EBITDA for transactions above $500 million TEV.
3. Morgan Stanley Investment Management as of June 30, 2023. Data represents a sample of 166 total transactions including only U.S. deals, excluding Morgan Stanley transactions—37 large cap and 129 middle market—that report on enterprise value, revenue, EBITDA, net debt, public/private company. Middle market is defined as a transactions value of $500 million or less.
4. Pitchbook 2023 Annual U.S. PE Breakdown: Private equity dry powder from funds with vintage year 2014–2023 and with a fund size of $5 billion or greater.Note: Historical characteristics are not indicative of future results.
Value creation from operational improvement
The majority of value creation in middle market private equity comes from operational improvement and not financial engineering. As you can see from the second chart below (“Return drivers for middle market buyouts”), well over half of the increase in value has come from improving business revenue, efficiency, scale, breadth, etc. Upper decile and upper quartile PE managers usually start analyzing the premise of any company they invest in with the following question: Why hasn’t a larger competitor already acquired this business and what can we do to improve operations enough to make it more attractive? And guess what, buying a company and piling on leverage to financially engineer more profitability would only make the company a less appealing acquisition target. In fact, as you see in the second chart below (“Weighted-average changes from sponsor entry to exit”), leverage levels tend to drop over the PE holding period as operations improve.
Return drivers for middle market buyouts

WEIGHTED-AVERAGE CHANGES FROM SPONSOR ENTRY TO EXIT
Middle market PE exits
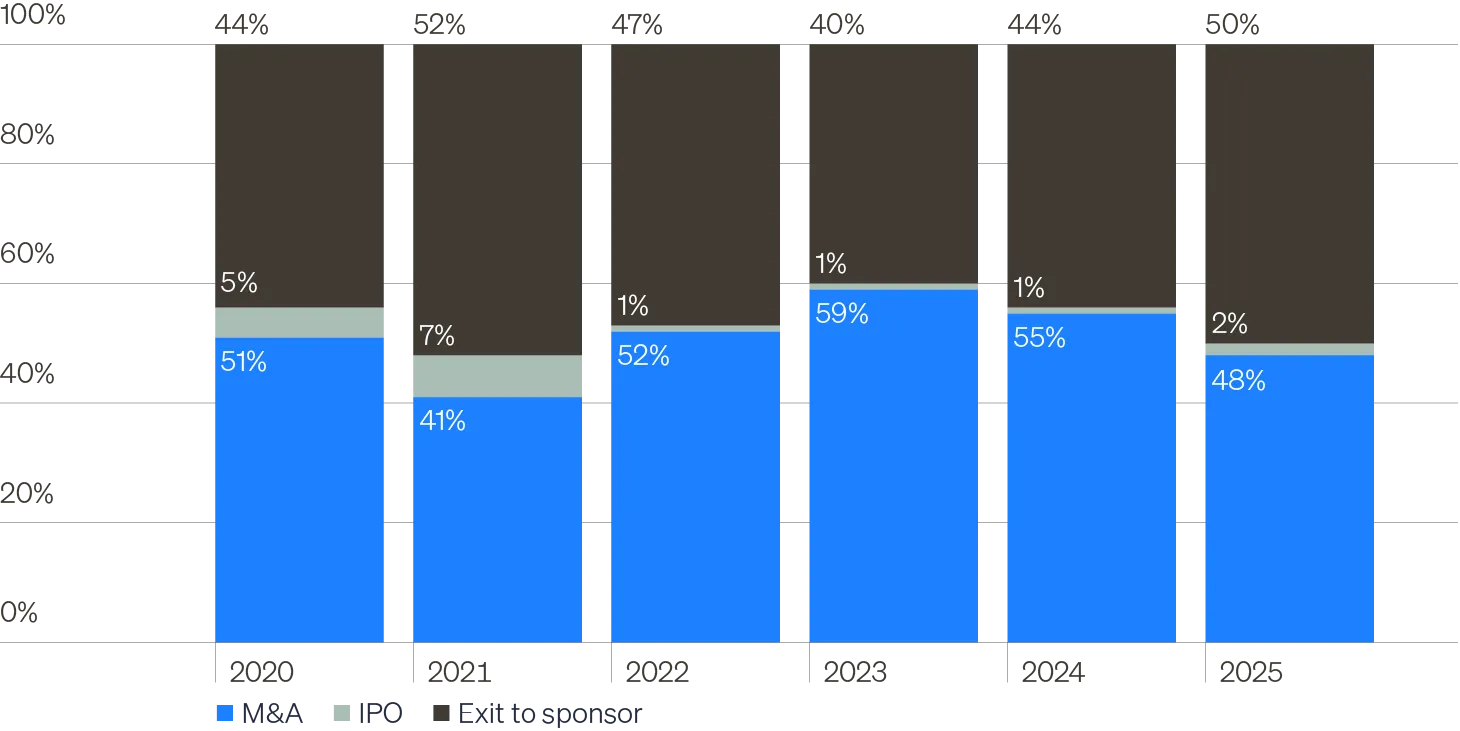
Turning our attention now to exiting middle market private equity held companies to generate liquid profits that could either be returned to investors in the later stages of a PE drawdown vehicle or recycled into new opportunities in an evergreen vehicle or the early stages of a drawdown vehicle, the middle market has a key advantage over large and mega cap PE: An almost complete lack of sensitivity to the IPO market.
Over a very long period of time, the number one exit strategy has been selling to a larger corporate entity (strategic acquirer) or to a larger private equity investor. As you see from the chart below (“More exit optionality for middle market as IPOs fall”), even in 2021, when the IPO and special purpose acquisition company (SPAC) markets were booming, only 7% of the exits from middle market PE were via public markets. Typically, it is only 1% to 3% per year.
As you can also see from the following chart (“Meaningful dry powder from upmarket sponsors”), there remains ample dry powder in U.S. mega cap PE shops to acquire privately held companies that have grown from $50 million of EBITDA to $100 million or from $25 million to $75 million. Additionally, this year in particular, the rise of general partner (GP)-led secondary volume has created a newish avenue for exiting positions if desired. This would still fall under the “exit to sponsor” category, but instead of a sale of the company to a new PE buyer, one can exit a co-investment by selling into the original sponsor’s continuation vehicle to new private investors.
More exit optionality for middle market as IPOs fall
Meaningful dry powder from up-market sponsors

Middle market answers IPO slowdown
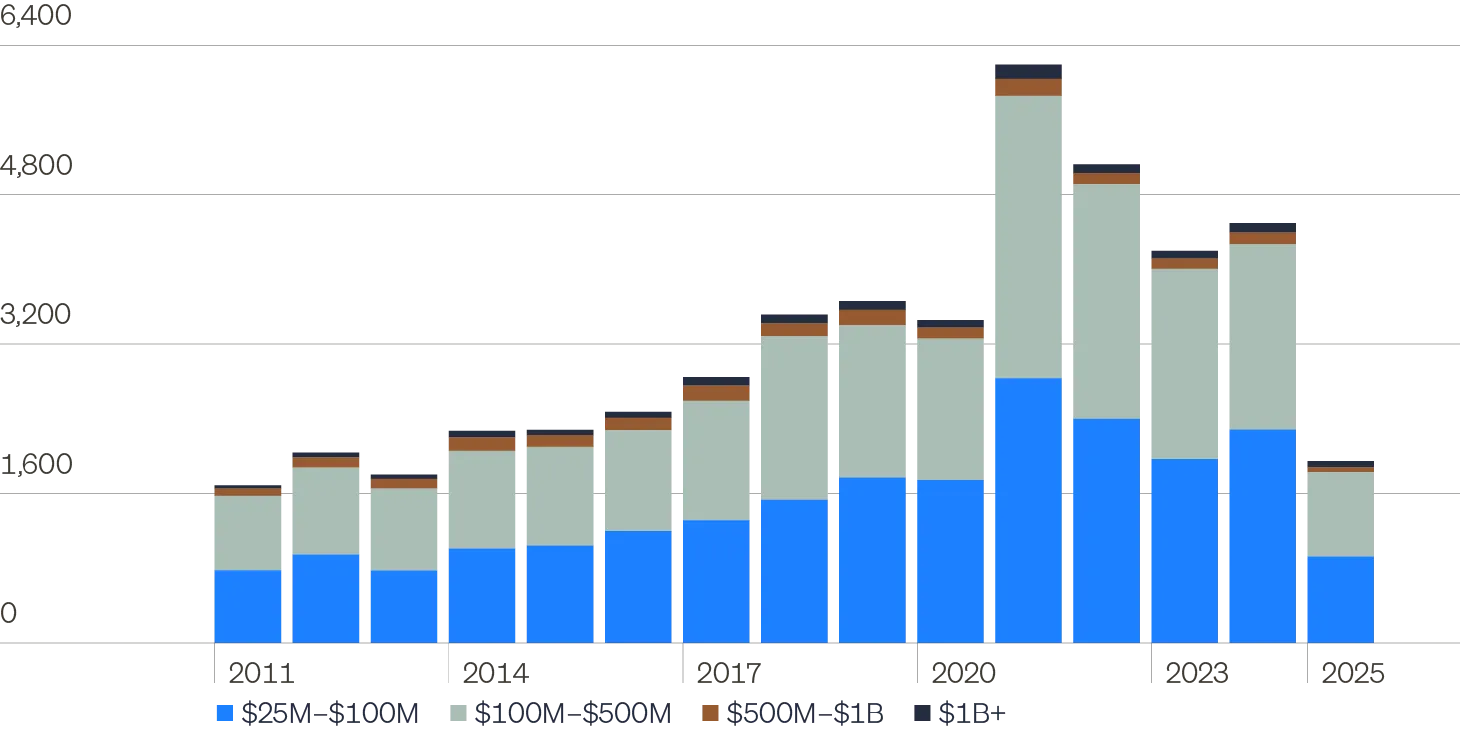
Lastly, in terms of corporate activity more broadly in PE, it is still clear the IPO market for anything non-hyper growth remains closed for the time being. We are rooting for it to reopen for the large and mega cap folks to provide liquidity to their investors and have even more buying power to pay up for our stuff. However, as usual, things look much rosier in the middle market. Even accounting for the Liberation Day driven slowdown in deal activity, through Q2, both deal count and deal volume are up substantially from last year and well above pre-pandemic levels. So don’t believe everything you read in the press: In the middle market, we are finding ample opportunity to put capital to work and to monetize positions that have run their course.
Steady supply of deals in the U.S. middle market
The investment thesis for middle market PE
The intellectual foundation of the investment thesis for middle market private equity is the presence of GARP in a GARP-less world. When you have GARP-like properties, not only can you potentially generate better returns if things go well, but you have less downside if/when things so south. The vastness of the middle market private corporate opportunity set can lead to alpha generation opportunities in excess of the asset class beta. Middle market private corporations have been a key wealth generator and families who created their wealth this way can now compound their wealth further. The structural advantages of middle market private equity over large and mega cap PE are profound and middle market PE corporate activity remains robust. Or said another way, the time for the right alts is still now!