
Introduction
Capital concentration, durably higher interest rates and secular shifts across technology and geopolitics are redefining the opportunity set. In this environment, outcomes are forged rather than found. Fund managers will need to generate returns through operational execution, not financial arbitrage, while allocators should embrace selectivity—favoring market segments with better entry points and lower competition, and managers with specialized capabilities over those reliant on scale.
Defining trends
We see three trends defining the private markets opportunity set in 2026.
A cyclical rebound – with a twist
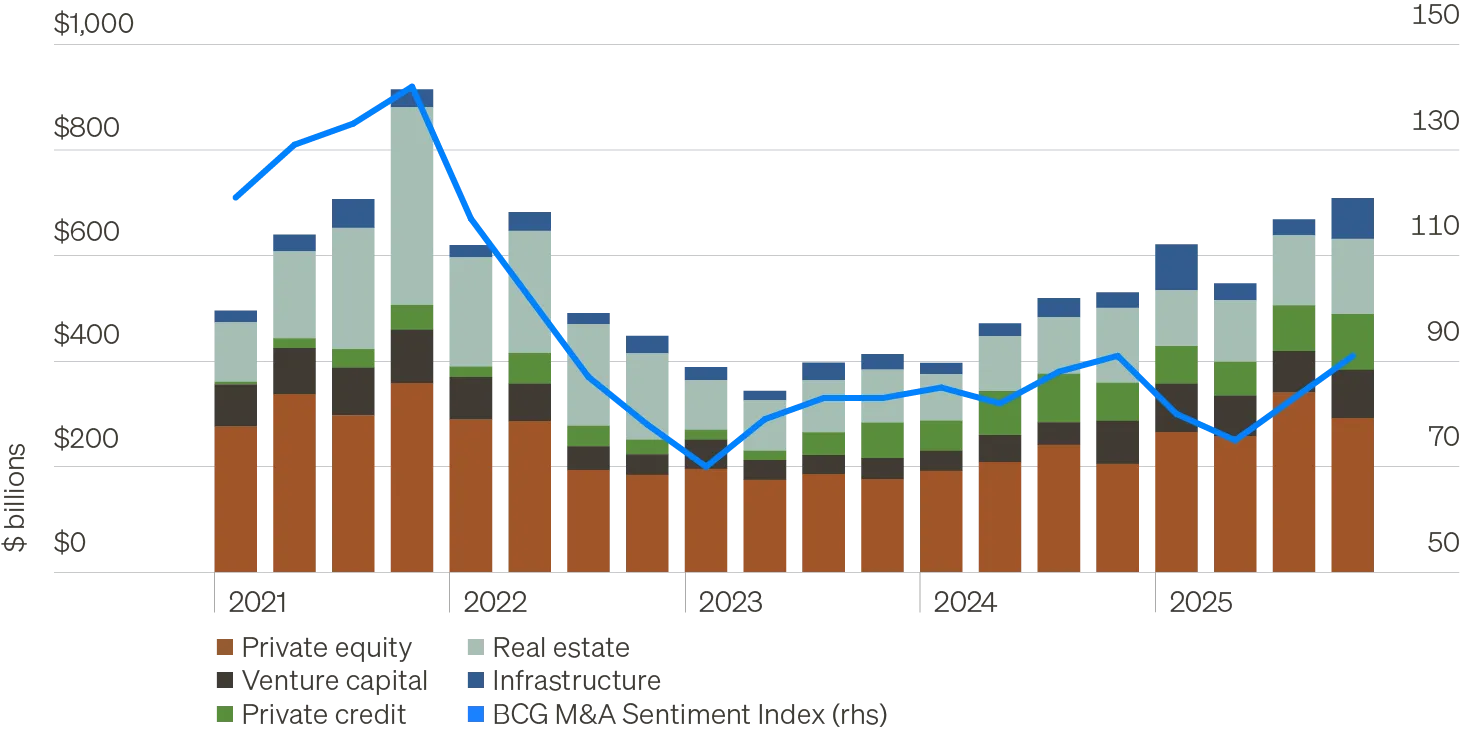
- What’s changing? After several years of muted activity and constrained liquidity, private markets are reaccelerating. Deal activity regained momentum late in 2025, with more than $700 billion of U.S. private capital deployed in Q4—the strongest quarter in four years.
- What’s driving it? Lower short-term rates, easing policy uncertainty, and a resilient economic backdrop are supporting renewed confidence. But unlike prior early-cycle rebounds, asset valuations (multiples, credit and cap rate spreads) never experienced a sharp reset.
- How should investors respond? With valuations still full in many parts of the market, broad early-cycle risk-taking is a suboptimal approach. The opportunity lies in targeting segments with more compelling entry points, and specialized strategies where competition is lower and barriers to entry are durable.
U.S. quarterly private markets deal activity
Structural capital concentration is reshaping markets
- What’s changing? Capital concentration across private markets has reached a tipping point. The Gini Index—a measure of inequality—has surged to record highs. Just 24 managers now control roughly half of the $24 trillion global private capital ecosystem.
- What’s driving it? Some degree of consolidation is natural as an industry matures. But more recently, capital has gravitated toward the largest managers as a stand-in for quality. As that behavior becomes widespread, competition ensues and quality degrades.
- How should investors respond? As capital crowds into the largest deals, opportunity is pushed down-market—where competition is less acute, information is less efficient, and managers can optimize for investment outcomes rather than deployment.
| Global private capital: Gini Index Based on manager AUM  |
Distribution of global private capital $ trillions  |
Source: Preqin, as of June 30, 2025.
AI is eating the world
- What’s changing? AI has embedded itself across capital markets at unprecedented speed. Companies tied to the AI buildout now comprise roughly half of S&P 500 market cap, with the theme increasingly pulling in credit and private markets.
- What’s driving it? An arms race among AI builders and infrastructure providers has created an insatiable appetite for capital. At the same time, enterprise adoption is rising rapidly but remains early, with many firms still working to maximize the benefits of AI.
- How should investors respond? Opportunity to deploy capital is expanding across asset classes. However, we believe investors should also prioritize diversifying exposure to AI builders with exposure to AI beneficiaries. Through hands-on ownership, buyout managers can drive AI adoption at portfolio companies across a diverse set of industries—creating value via productivity gains.
AI adoption and capital markets penetration

Forging ahead: A new cycle, and a new regime
As a new year begins, the risks facing public markets—record valuations, technology concentration, rising correlations, and rate sensitivity—are significant. Private markets offer meaningful ways to address these challenges, and the emergence of a new cycle widens the aperture for doing so.
But beyond the cycle, markets are entering a new regime, defined by higher rates, greater macro and geopolitical volatility, and rapid technological adoption—all of which alter how value is created. Private capital concentration has turned scale into a headwind for investors, pushing opportunities for differentiation into specialized and less competitive segments. In this environment, discipline, selectivity, and operational execution will matter more than ever, favoring investors able to adapt with the times and forge ahead into a new private markets era.
Middle market macro view
2025 marked a mid‑decade inflection point. As the transition gives way to a new economic era, the U.S. outlook remains constructive but unevenly distributed. Productivity gains, supportive policy on net, and strong household balance sheets underpin growth, while AI monetization, policy uncertainty, and weak housing dynamics add variance.
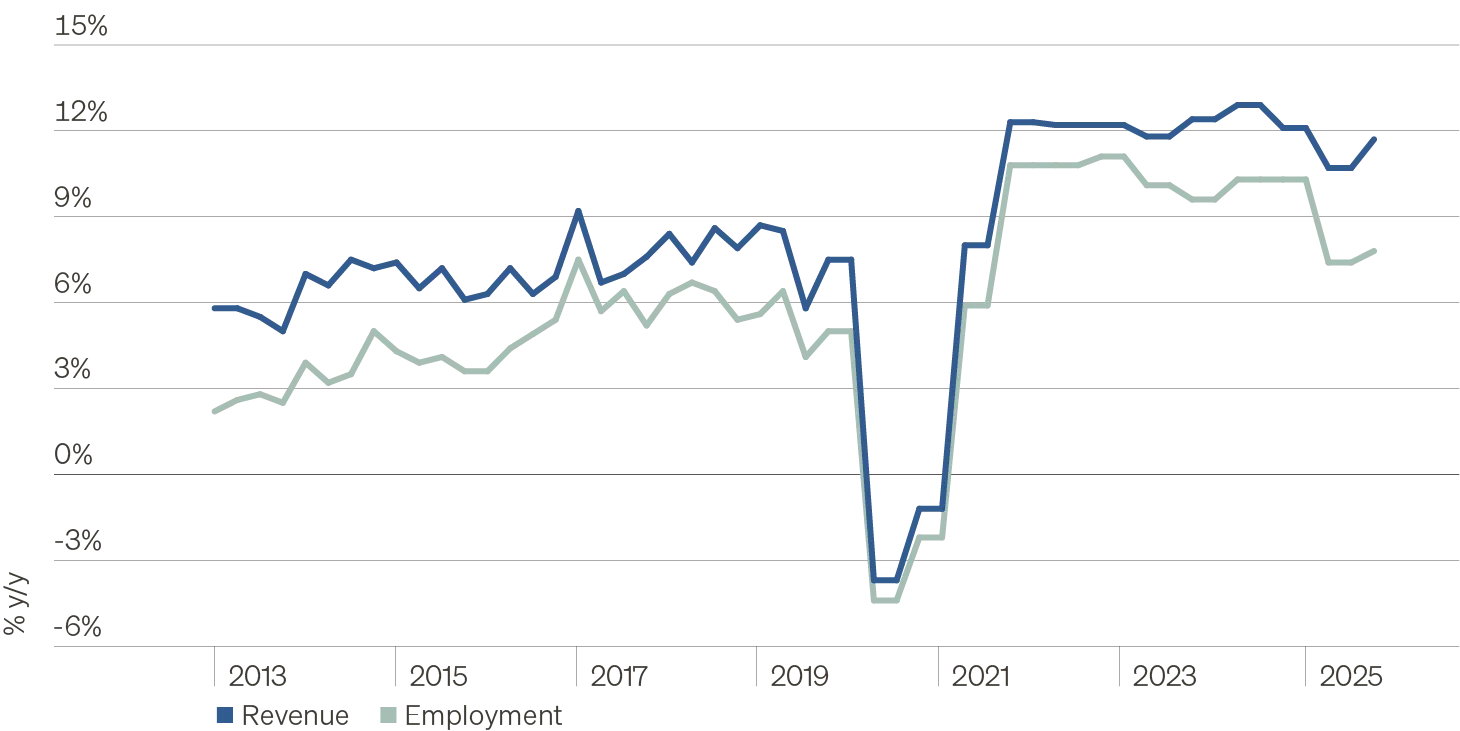
The middle market—deriving roughly 85% of revenue domestically—enters 2026 on firm footing. After a mid‑year slowdown, confidence has improved, and margins appear poised to recover as productivity gains flow through. AI adoption, reshoring, and new tax provisions create tangible growth opportunities, reinforcing a supportive backdrop for private capital serving middle market businesses.
U.S. middle market revenue and employment growth
Private equity
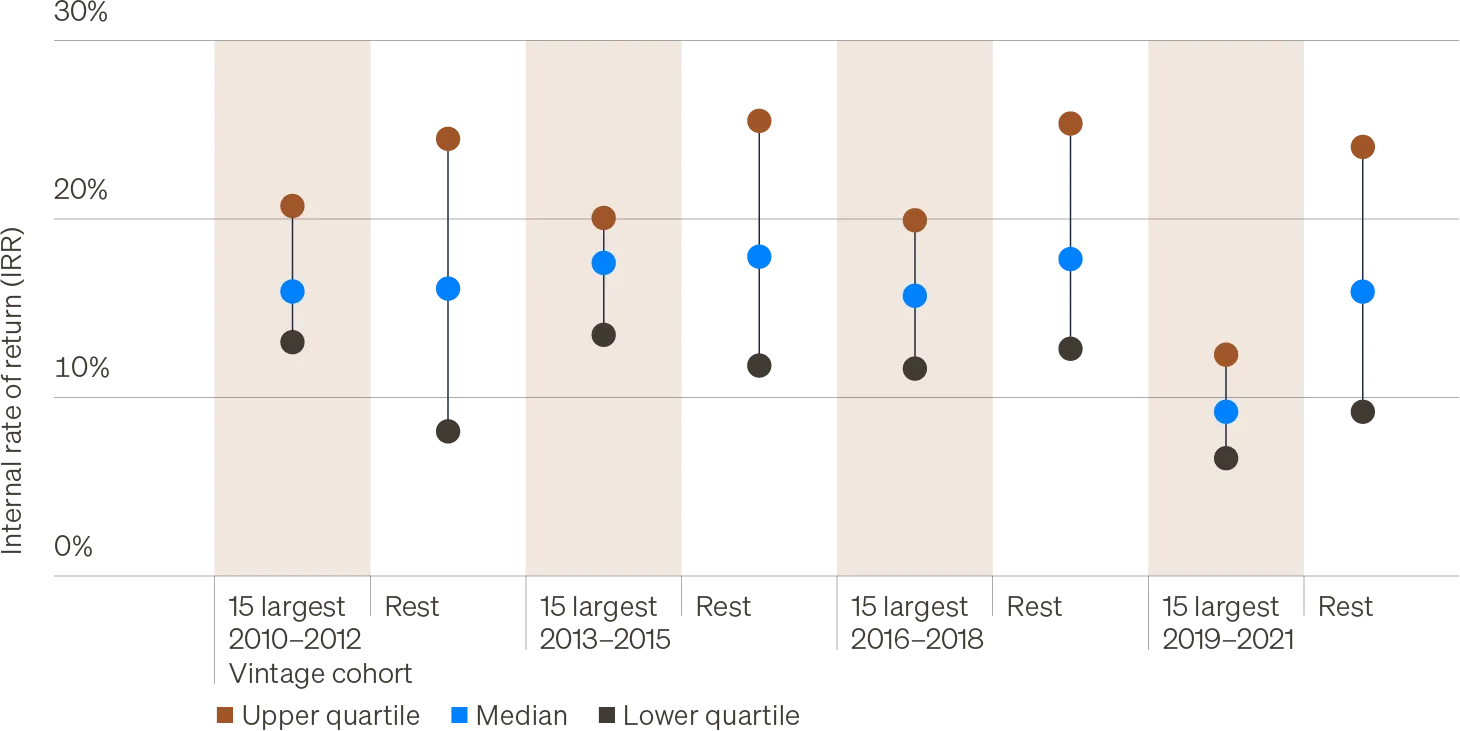
Dealmaking momentum has returned, with the second half of 2025 the strongest period since 2021. But capital concentration at the top end of the market is compressing opportunity, as larger funds face higher valuations, greater competition, and fewer exploitable inefficiencies—leading to pedestrian relative performance.
In this environment, operational value creation will be decisive. AI adoption presents a generational opportunity for hands‑on managers to drive productivity and product enhancement—while also providing natural diversification from AI infrastructure-dominated public markets.
Key priorities for 2026:
- Diversify public equity concentration: Use private equity to complement exposure to AI builders with access to AI adopters.
- Favor smaller, fragmented markets: The lower and core middle market offer better entry points and greater scope for differentiation.
- Prioritize specialization and operational edge: Managers with deep, repeatable expertise—by industry, geography, or segment—and operational know-how should have an advantage over scaled generalists.
PE buyout performance, by fund size and vintage cohort
Private credit
Despite widespread debate and numerous headlines, 2025 delivered strong performance, moderate defaults, and a yield premium versus public credit consistent with history. That healthy starting point sets the stage for a broader opportunity set in 2026, as M&A activity improves and origination volumes expand.
Rates have eased enough to support borrowers while remaining high enough to generate attractive all‑in yields. As the market grows and expands, the significance of differentiation will be enhanced.
Key priorities for 2026:
- Lean into specialization: Higher‑spread core and lower middle‑market credit, asset‑based finance, and non‑sponsored lending offer more attractive risk‑adjusted opportunities than commoditized upper‑market exposure.
- Pursue true diversification: AI has become the dominant cross-asset class theme, and private credit’s exposure will grow. Balance AI‑linked exposure across builders and adopters and diligently underwrite disruption risk.
Direct lending sector composition
Cumulative change since Q1 2012
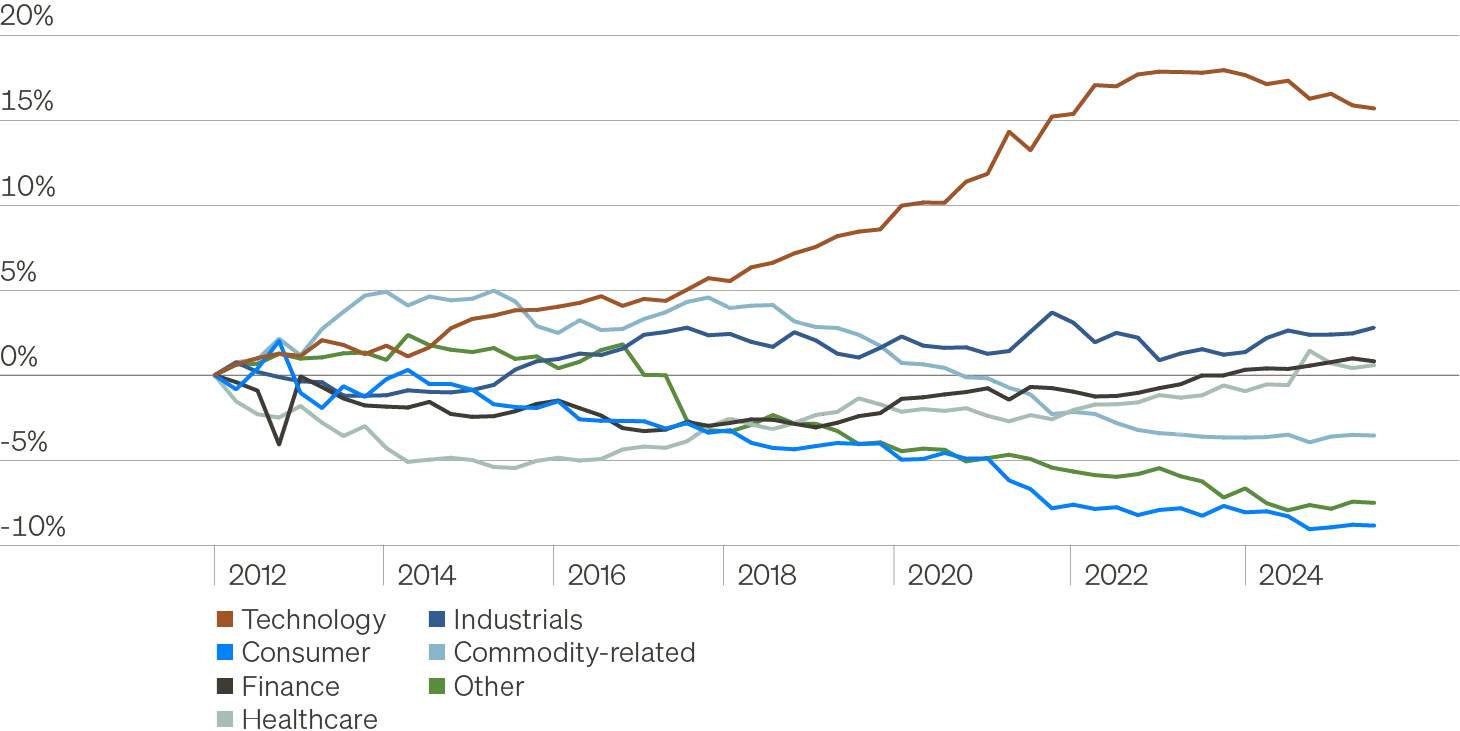
Note: Commodity-related exposure includes the energy, materials, and real estate sectors. Industrials exposure includes industrials and business services. Consumer exposure includes the consumer discretionary and consumer staples sectors.
Commercial real estate
Commercial real estate is entering a new cycle, but one defined by income rather than price appreciation. Transaction activity rebounded in 2025, yet valuations remain anchored as cap rate spreads remain historically tight.
With limited scope for appreciation, income and execution will drive returns. Fundamentals are set to improve in select sectors as supply moderates, but elevated financing costs continue to dampen equity upside.
Key priorities for 2026:
- Debt remains compelling: Elevated yields, rising refinancing demand, and expanding market share for alternative lenders support a continued focus on CRE debt, which has outperformed over the past three years.
- Selective in equity: Core‑plus and targeted value‑add strategies that balance in-place income with operational upside look most attractive.
- Secondaries offer compelling access points: Attractive discounts in real estate secondaries offer an additional margin of safety in an otherwise tight valuation environment.
Annualized time-weighted returns for CRE closed-end funds

Note: 2010–2019 returns for senior debt funds use funds designated senior and generalist due to data availability.