

Until recently, the AI build-out was primarily funded internally by a handful of hyperscalers—Amazon, Microsoft, Alphabet, Meta and Oracle. As recently as 2021, these companies generated combined free cash flow (FCF) margins of around 30%; given their enormous scale, that translated into hundreds of billions of dollars in annual FCF.1 The incredible profitability of their incumbent cloud businesses provided a buffer as total capital expenditures increased from $134 billion in 2023 to $414 billion in 2025, allowing the hyperscalers to fund the expensive AI build-out without relying heavily on capital markets. But even for the most profitable firms in the world, that model always had a limit—and it has now been reached. Aggregate FCF will likely approach zero by year end, underscored by Alphabet’s recent announcement that FCF had turned negative for the first time since going public in 2004. This means the next leg of capital spending growth—from $414 billion in 2025 to $1 trillion in 2027 and beyond—will be mostly externally funded.1
AI hyperscaler CAPEX and free cash flow
Aggregate forward 12-month consensus estimates
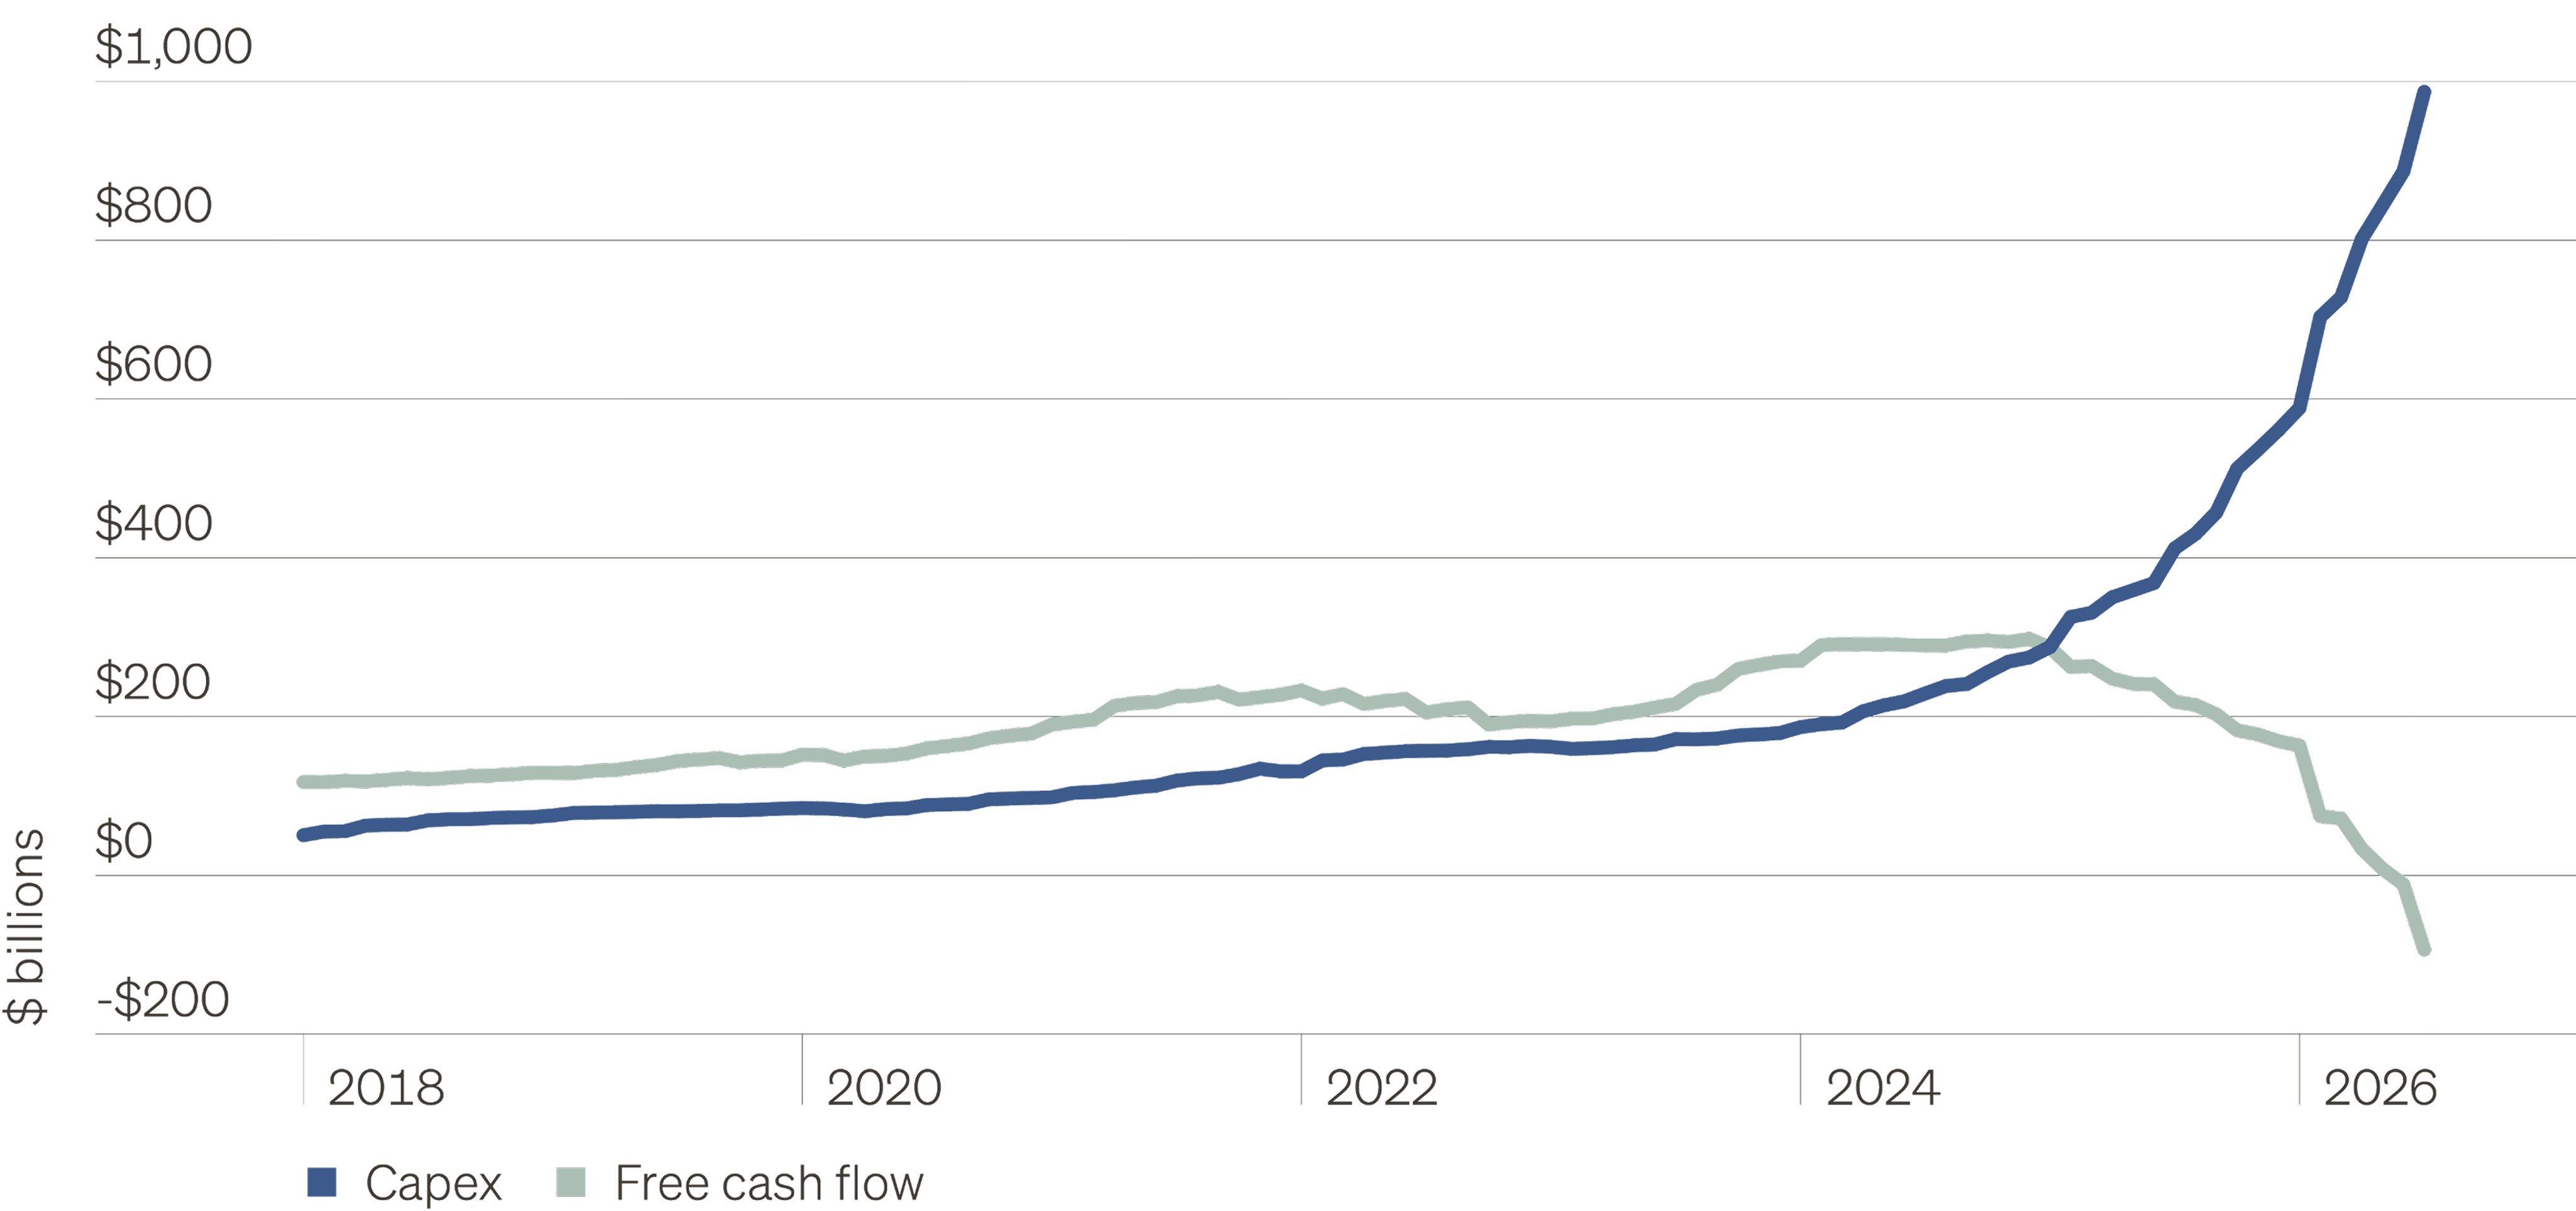
Note: AI hyperscalers include Meta, Alphabet, Microsoft, Amazon, Oracle and CoreWeave.
This represents an inflection point not just for big tech, but also broader capital markets and portfolio construction. Most investors understand the portfolio implications of the AI boom as primarily the emergence of historic public equity concentration in the hyperscalers and their semiconductor suppliers whose chips populate their data centers. This is a true, but increasingly incomplete accounting. As financing needs surge to meet unprecedented investment and the AI ecosystem becomes more complex, nearly all major asset classes—equity, debt and real assets, both public and private—are being recruited to fill the gap. As a result, AI exposure is spreading rapidly across portfolios, fundamentally changing how investors must think about diversification. The pace of this spread is likely to increase in the coming years, posing a fundamental allocation question: Allow portfolios to passively double and triple down on AI exposure, or actively seek exposures with different fundamental drivers? In this note, we estimate current AI exposure across asset classes and provide context for its future direction, with the goal of providing investors the tools to answer that most essential question.
What is AI exposure?
Before quantifying AI exposure in portfolios, we must first define what it is. There are numerous methods that can be applied, none of which are perfect. We opted for a methodology that prioritizes simplicity and balance: Simple enough to apply across asset classes, and disciplined such that we capture the major channels of AI exposure without materially over- or understating it. We categorize AI exposure into three tiers: AI Core, AI Enablers and AI Appliers. Some investments may fit into multiple tiers; for example, Microsoft could be categorized as Tier 1 due to its cloud platform (Azure), or Tier 3 as a seller of AI applications (e.g., Copilot). This is an immensely complex ecosystem, and readers should treat the data we provide as a guidepost rather than an exact science.
The tiers below represent broad and distinct segments of the AI ecosystem. Each tier captures a different form of economic exposure to AI, but all share a common link: The fundamentals of the companies and assets included are meaningfully tied to AI demand, AI-related products and, ultimately, the return on AI investment. Tier 1 can be thought of as the manufacturers and distributors of artificial intelligence, which directly monetize demand for that intelligence. Tier 2 represents the infrastructure layer of AI, supplying the physical inputs necessary for creating artificial intelligence. These companies and assets sit one layer away from direct AI demand—they monetize the demand for inputs that falls out of demand for intelligence. Finally, Tier 3 represents a broad swath of companies implementing AI into their products and services. For some, exposure to AI can be considered a double-edged sword: A potent source of innovation, but also a potential driver of disruption. While the tiers can be thought of as measuring proximity to underlying AI demand, we view them primarily as a way to distinguish between different economic relationships to AI, not as a ranking of AI “purity,” which can vary considerably from one asset to another.
What does AI exposure look like across asset classes?
Next, we map current exposure to each of these AI tiers for each major asset class. Due to the granularity of available data, our public asset class exposure data points are measured with a strong level of precision. For private asset classes, we estimate AI exposure using available data on fundraising, deal volumes, reported sector composition and market observations.
Estimated AI exposure, by asset class
Categorized by tier
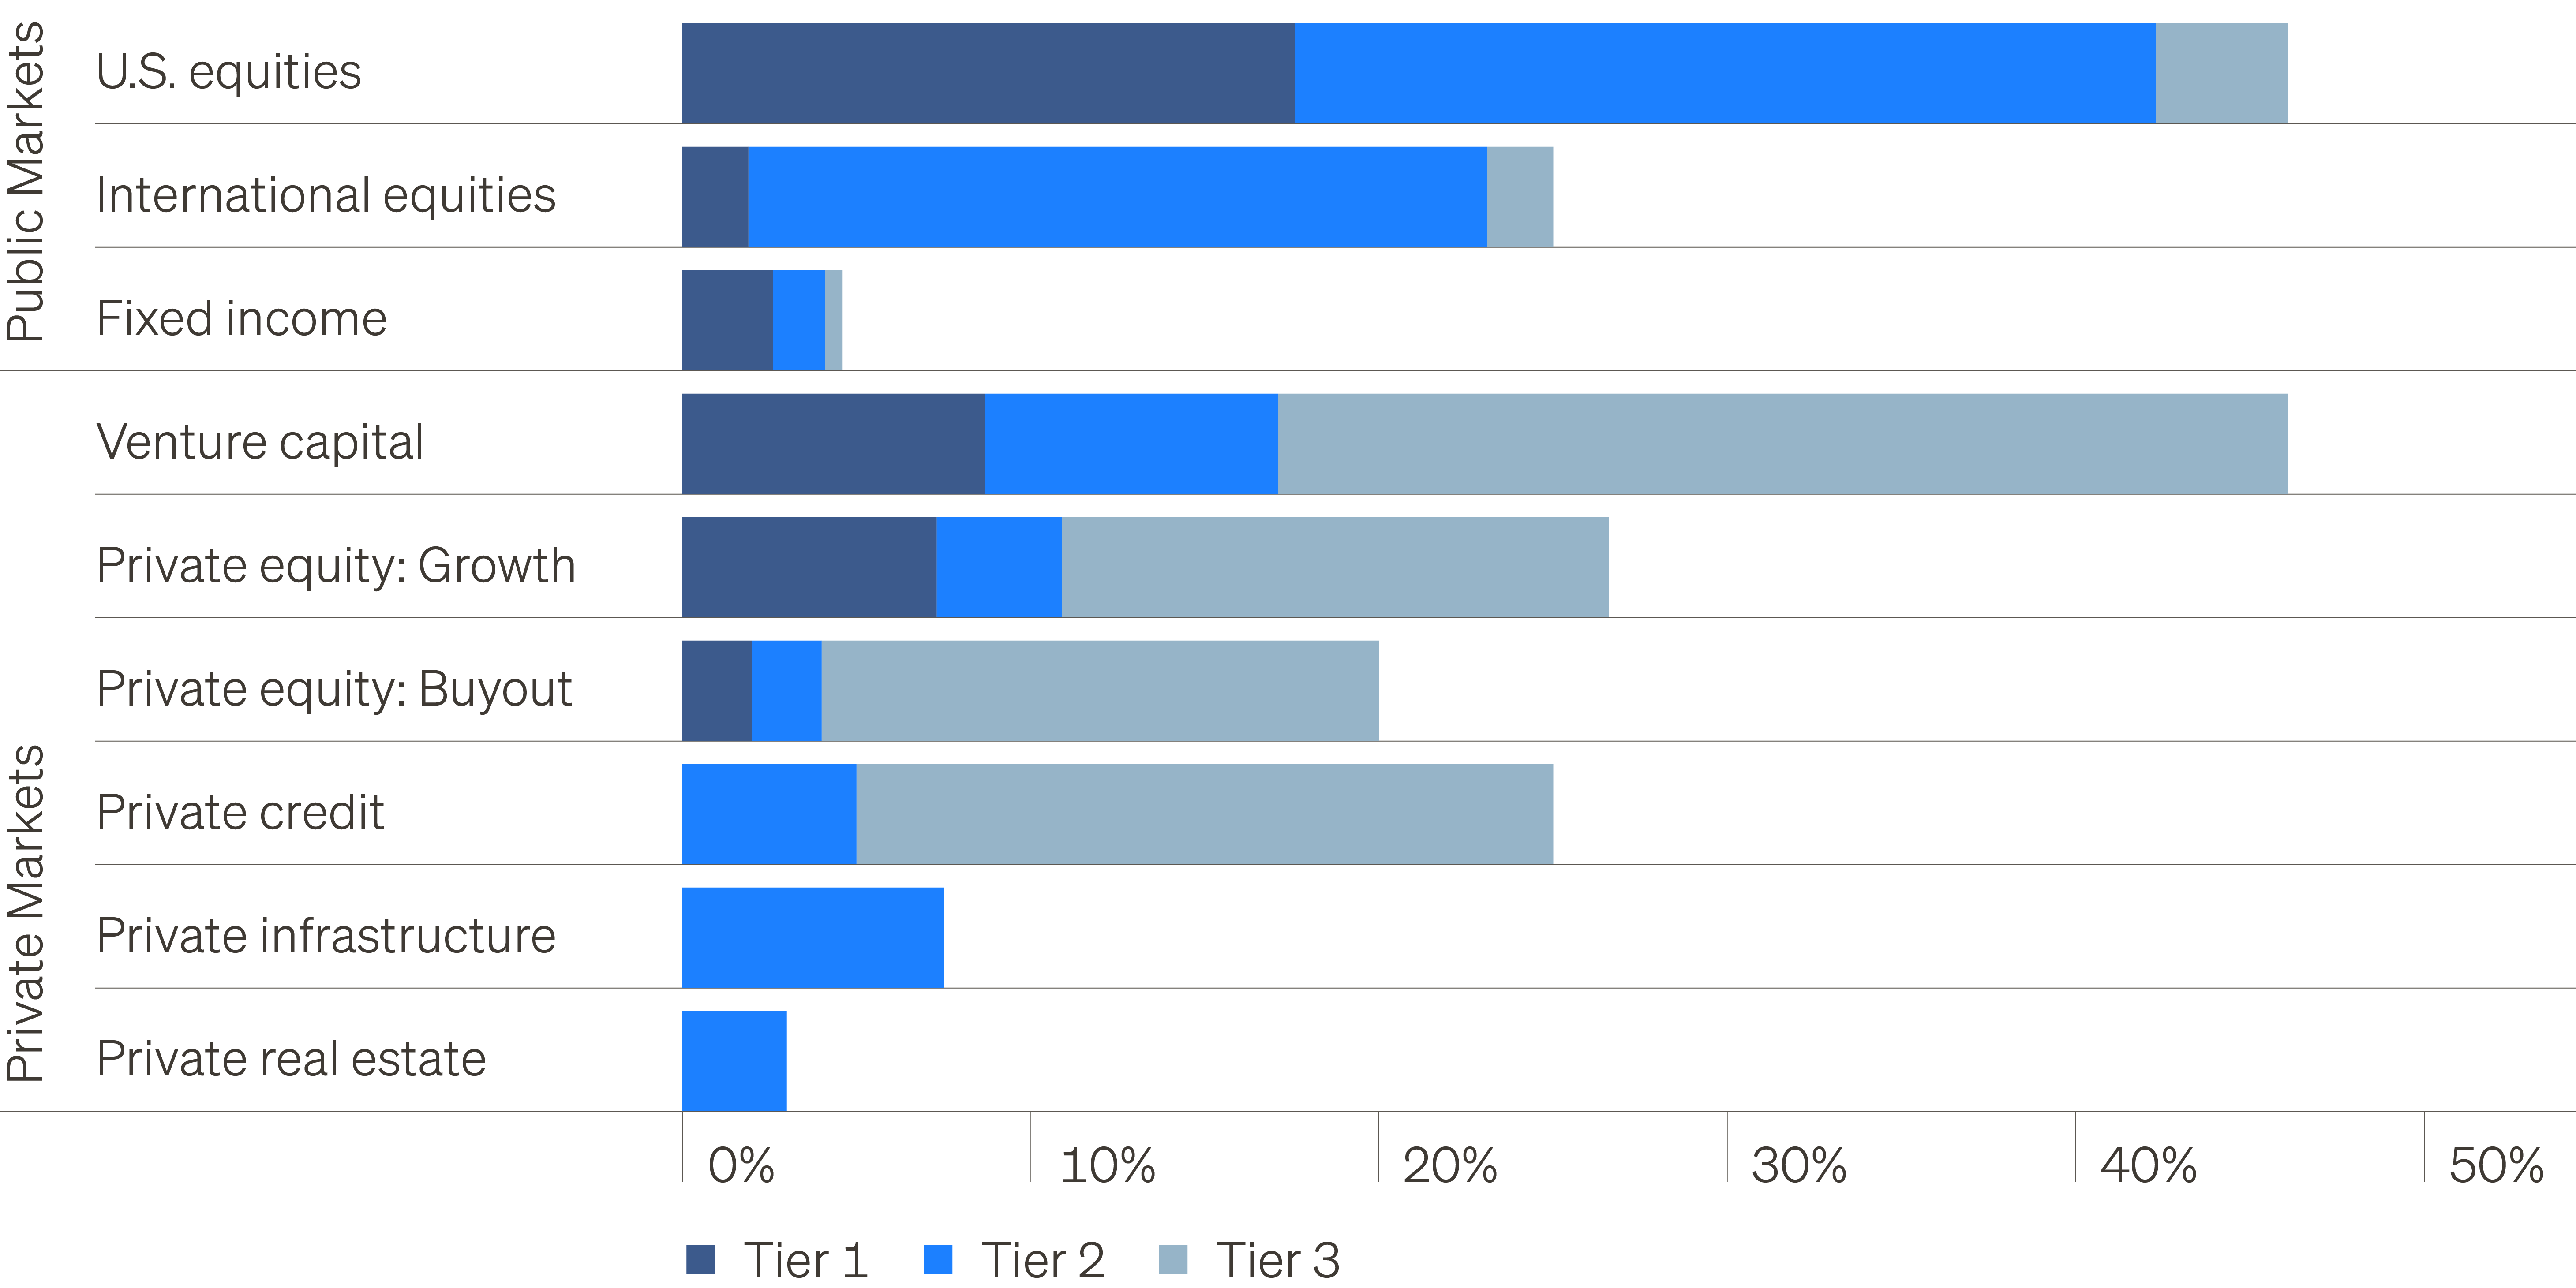
The chart above estimates the existing stock of AI exposure today, but an equally important consideration is its share of the flow of new capital formation. In most asset classes, AI’s share of new capital markets activity is already much higher than its share of the existing asset base. That distinction matters most in private markets: A public equity exchange-traded fund (ETF) gives investors exposure to today’s assets, while a new private fund commitment largely funds future deployment. As AI absorbs a growing share of new investment activity, flow may be a better gauge of AI exposure for new private markets allocations than the current stock of assets. On the following pages, we detail current AI exposure by asset class and where it may head as capital markets trends evolve.
Public markets
Current exposure U.S. equity markets carry the bulk of in-place AI risk for most diversified portfolios. The 46% exposure in the S&P 500 is mostly split between Tier 1 (which includes the major hyperscalers) and Tier 2 (mostly semiconductors, alongside certain AI-exposed industrials, energy and utilities firms), while Tier 3—largely software—plays a smaller role.1
Future exposure The direction of AI exposure will largely be dictated by the relative performance of AI-exposed stocks. However, potential trillion-dollar IPOs for Anthropic and OpenAI—alongside the recent SpaceX listing—could lead to AI exposure in the S&P 500 eventually breaching 50%, pending eventual index inclusion.1
Current exposure Public non-U.S. stocks carry 25% exposure to the AI theme, with most of that exposure concentrated in Tier 2. The lack of Tier 1 exposure outside the U.S. highlights the extent of U.S. dominance in the AI Core. However, non-U.S. firms play critical roles in the infrastructure supply chain, especially in semiconductors (ASML in the Netherlands, TSMC in Taiwan, Samsung and SK Hynix in Korea).1
Future exposure Like the U.S. market, the direction of exposure will mostly depend on relative market performance rather than a wave of new IPOs. Incremental Tier 1 exposure via new listings is most likely to come from China.
Current exposure The AI-exposed share of U.S. investment grade (IG) corporate bonds sits north of 9%, more than half of which comes from U.S. and Chinese (issued in U.S. dollars (USD)) hyperscaler issuers. The remaining 4% is mostly comprised of semiconductor and software issuers. Assuming a 50% Treasuries/50% IG bond fixed income portfolio, we estimate AI-related fixed income exposure of 5%.1
Future exposure U.S. hyperscalers are now among the largest IG issuers, accounting for 18% of gross issuance over the past year. Adding Tier 2 and Tier 3 issuers brings that share of new issuance to nearly 25%. Alongside growing activity in leveraged finance markets (high yield and leveraged loans), AI exposure is set to rise across fixed income and credit markets in the coming years.1
Private markets
Current exposure Venture has been a key early funder of the AI ecosystem, backing the major AI labs, semiconductor startups and firms across industries that are deploying AI innovatively—from vertical AI software applications to robotics. Pitchbook estimates in-place AI exposure for existing venture capital assets is 46%.2
Future exposure AI’s share of total venture capital (VC) deal volume in the first half of 2026 was 86%.2 While recent data have been skewed by massive investments into OpenAI and Anthropic over the past 18 months, the majority of venture capital will continue to be deployed into AI-related companies. It is not unreasonable to expect new‑vintage VC will have upward of two-thirds AI exposure.
Current exposure Growth strategies generally take minority stakes in mid/late-stage private firms, making the market a key AI funder as the ecosystem expands. We estimate growth equity currently holds AI exposure of around 27%, comprised of the largest private modelmakers (Tier 1) alongside a significant allocation to software (Tier 3).2
Future exposure Nearly half of growth equity deal flow went to AI-related firms in 2025, which we estimate is split roughly evenly across the tiers.2 It is reasonable to expect average new-vintage growth equity allocations could contain AI-related exposure of 50% or higher.
Current exposure Most AI exposure in buyout funds comes from software (Tier 3). That industry—whose relationship with AI is one of both opportunity and threat— became the largest recipient of buyout capital over the past five years, especially for large-cap strategies. Our estimate likely understates buyout AI exposure, particularly for Tier 2 AI infrastructure companies, due to a lack of data availability.2
Future exposure Software disruption concerns caused sector deal volume to plummet this year. Should this hold, software exposure in the broader buyout market could fall over time, specifically for new vintage funds. Large-cap dollars earmarked for software in past vintages are now being rerouted toward AI infrastructure opportunities, suggesting overall exposure is unlikely to decline.
Current exposure As the primary leverage provider for buyout sponsors, direct lending strategies hold a roughly 20% allocation to software.3 Beyond software, AI infrastructure developers have begun tapping private credit for massive bespoke financing packages, the sum of which is difficult to quantify today. We estimate these financing packages— which can take the form of infrastructure debt, project finance, asset-backed lending or other structures—conservatively add an incremental 5% in Tier 2 exposure.
Future exposure Software exposure in direct lending could decline over time, but private credit is set to become perhaps the largest incremental funder of AI infrastructure development. The opportunity for private credit is expanding rapidly due to its ability to offer customized financing, along with capacity constraints in public bond markets. Morgan Stanley estimates private lenders could provide $800 billion in financing over the next three years, equal to 21% of current global private credit assets under management (AUM).3,4 While some of that capital will come from insurance pools, a substantial portion will be spread across various private credit investment vehicles. As a result, we expect a sharp increase in Tier 2 exposure over time.
Current exposure AI exposure in infrastructure largely sits across two verticals: Digital infrastructure, which includes data centers and the networks that connect them to the world; and energy & power assets, which generate and distribute power to the data centers. Most of the existing digital and energy infrastructure assets are likely not primarily AI-related, though some may eventually benefit from AI demand. We estimate current infrastructure exposure to AI-related assets between 5% and 10%.5
Future exposure Infrastructure capital flows have shifted significantly in recent years. Digital infrastructure and energy & power comprised almost half of total deal flow in 2025–2026, up from 30% in 2023–2024.5 Using conservative assumptions, we estimate AI-exposed infrastructure deal flow at roughly 30%, broadly in line with our observations of recent-vintage fund allocations.
Current exposure AI exposure in real estate sits primarily in data centers, long a niche strategy within the asset class. Today, data centers comprise 14% of the publicly traded REIT market, but less than 2% of core private real estate (NCREIF ODCE Index). We estimate the exposure of the broader private real estate market sits somewhere in between, at 6%. If half of current data center exposure is AI-related, that leaves us at about 3%—the lowest of any asset class.6,7
Future exposure The once-distinct roles of infrastructure and real estate capital are merging to meet the financing needs of the AI data center ecosystem. Data centers accounted for 6% of U.S. CRE trailing 1-year transaction volume but 15% of global cross-border deal flow, suggesting large-scale institutional capital is migrating quickly to fund sizable AI data center campuses.8 As data centers begin to generate cash and stabilize, we expect it to become a new primary property type for real estate investors. AI exposure will rise commensurately.
A full portfolio view
The exhibit on the next page applies our asset class estimates to three representative allocations: a traditional U.S. 60/40 portfolio, a 55/35/10 portfolio designed to approximate a private wealth allocation with moderate private markets exposure, and a private markets-heavy institutional portfolio. Despite substantial differences in construction, estimated AI exposure falls within a relatively narrow range of 25% to 30%, though where that exposure resides does change meaningfully. In the U.S. 60/40, nearly all AI exposure comes from public U.S. equities. The institutional portfolio accumulates exposure across public and private markets. This highlights a key takeaway: asset class‑level diversification changes the form of AI exposure more than the amount.
AI should not be interpreted as a single, uniform risk factor. Each tier occupies a different position in the ecosystem and can respond differently as the cycle evolves. For example, the correlation between semiconductor and software stocks’ relative returns has turned sharply negative this year, suggesting investors increasingly view them as opposite sides of the AI trade. Still, over the long term, the investments included in this analysis all have real economic exposure to the return on AI investment. The form of exposure matters as well. A hyperscaler bond and a venture investment in an AI startup carry fundamentally different downside characteristics despite sharing a thematic driver.
The analysis is therefore less a definitive measure of AI risk than a framework for asking better portfolio-level questions. Each allocator will need to account for the specific holdings and risk exposures represented in their own portfolio, along with their own views on AI. But the direction of travel is increasingly clear: Absent deliberate portfolio decisions, the enormous capital needs of the AI build-out will drive thematic concentration even higher in the coming years.
Stacking up AI exposure in portfolios
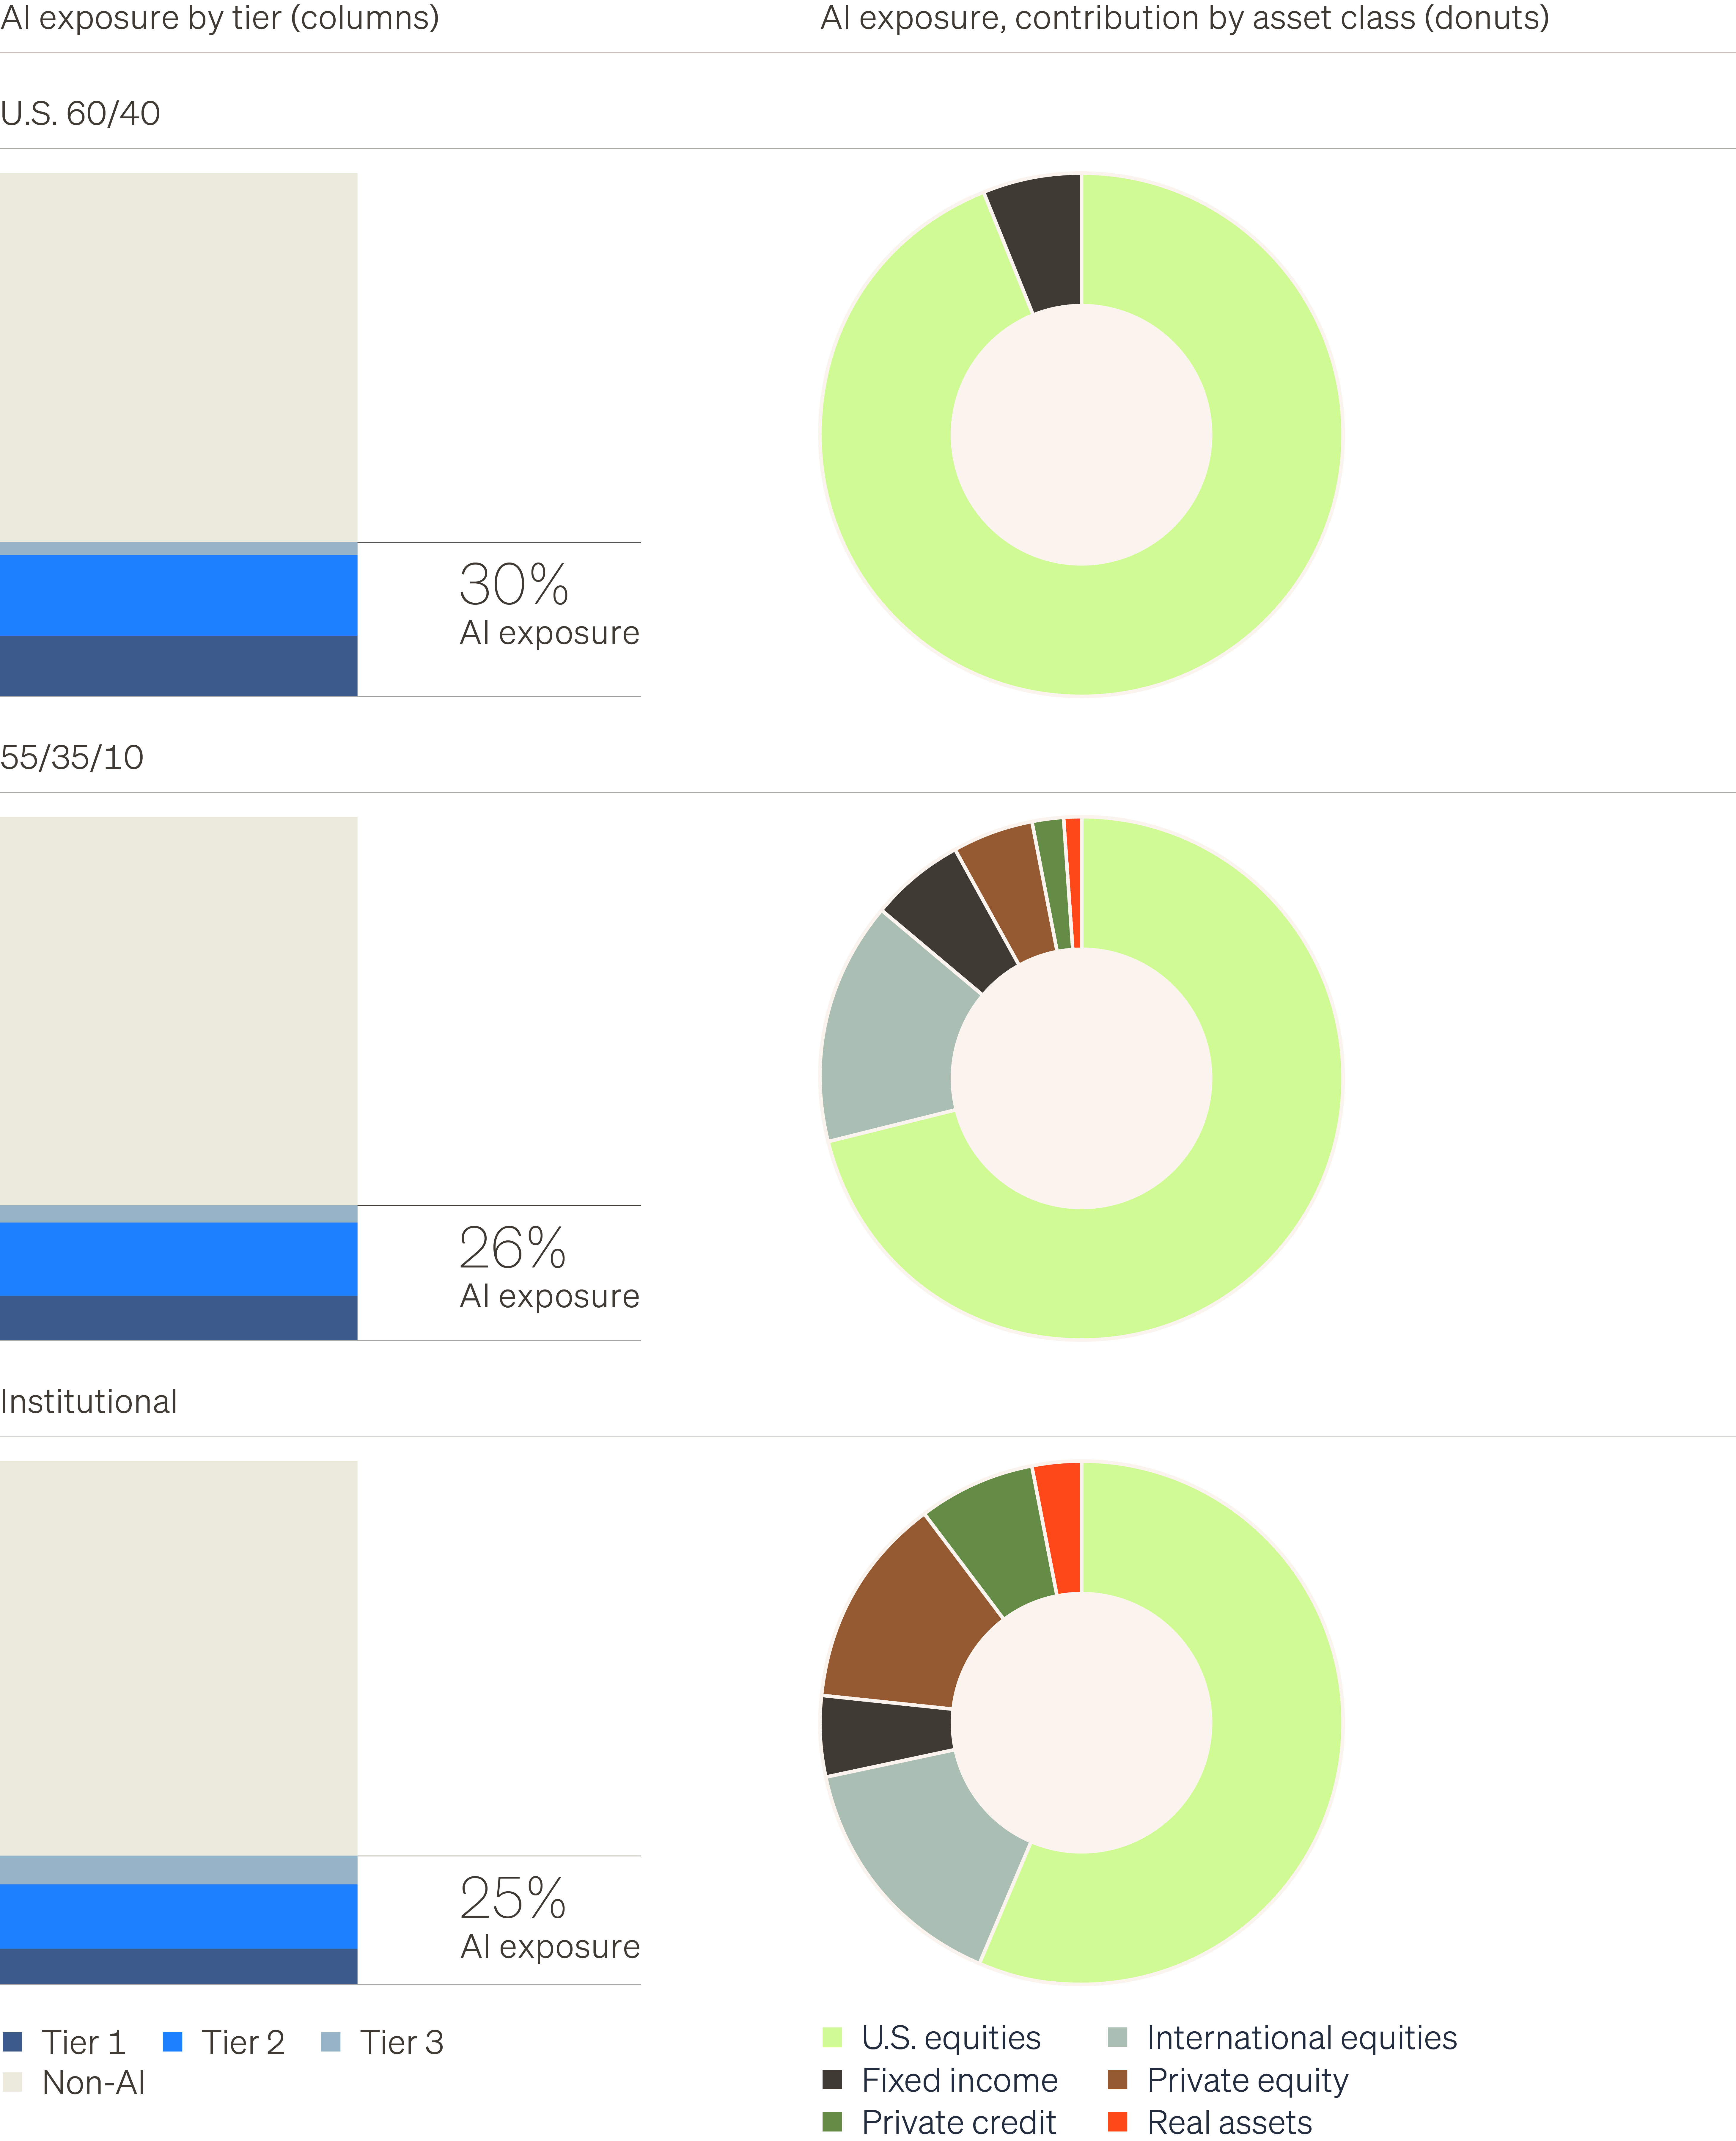
Note: The U.S. 60/40 holds 60% in U.S. equities and 40% in Fixed income. The 55/35/10 portfolio holds 40% in U.S. equities, 15% in International equities, 35% in fixed income, 2.5% each in PE buyout and Private credit, 2% in Real estate, and 1% each in PE Growth, Venture and Infrastructure. The Institutional portfolio holds 30% in U.S. equities, 15% in International equities, 25% in Fixed income, 8% in Private credit, 7% in PE buyout, 5% each in Infrastructure and Real estate, 3% in Venture and 2% in PE Growth.
Conclusion
The level of AI exposure in a diversified portfolio may surprise investors, particularly because most did not make an explicit decision to allocate 25% to 30% to a single theme. That exposure accumulated rapidly—first as the world’s largest technology companies committed FCF to AI, and more recently as the financing burden spreads across capital markets. As this trend accelerates, below we discuss three key implications for allocators.
Private markets will fund the incremental AI dollar. The growing size and complexity of the AI build-out requires flexible and scalable capital solutions—challenges private markets are uniquely positioned to meet. This will create significant new opportunities for investors to participate in the AI economy. But it also means that, as AI-related businesses and infrastructure come to represent a larger share of deal activity, private markets beta will increasingly migrate toward AI beta. The pace of this shift for a given portfolio will depend on both overall allocation to private markets—where exposure is set to rise most rapidly—and the pace of deployment into new-vintage strategies. Allocators looking to offset this increase can use our framework to direct new capital toward differentiated opportunities.
The essence of diversification has changed. Allocators accustomed to utilizing a traditional asset class framework for portfolio construction should consider introducing a diversification framework based on economic exposure. A portfolio comprised of hyperscaler common equity, GPU-backed credit and AI data center ownership may not be reliably diversified—even if each resides in a different asset class bucket and carries a different risk profile. Risk management of thematic concentration requires a more hands-on approach than traditional asset class allocation schemes provide. Not adapting to this reality risks allowing these portfolio imbalances to build even further.
The value of non-AI-driven outcomes has increased. AI-related assets have largely delivered strong performance for investors over the past few years, and many will continue to do so. But the rapid increase in AI exposure within portfolios introduces a premium for assets that can deliver on growth, income and risk objectives while offering a different fundamental economic exposure. Put simply: If two assets both offer an expected return of 8% and a volatility of 5%—and Asset A is closely tied to AI demand while Asset B relies on different fundamental drivers—Asset B provides more value to the portfolio. In a market increasingly tethered to one theme, genuinely independent sources of return have become more valuable.