As public markets grow more expensive, U.S. buyout valuations offer compelling value.
authors
Christopher Bole
Christopher Bole
Vice President, Financial Writer
Public and private U.S. equity valuations (Trailing EV/EBITDA multiples)
Line chart showing valuations (trailing enterprise value/earnings before interest, taxes, depreciation, and amortization (EBITDA)) across public and private equity markets. Private market valuations offer compelling value.
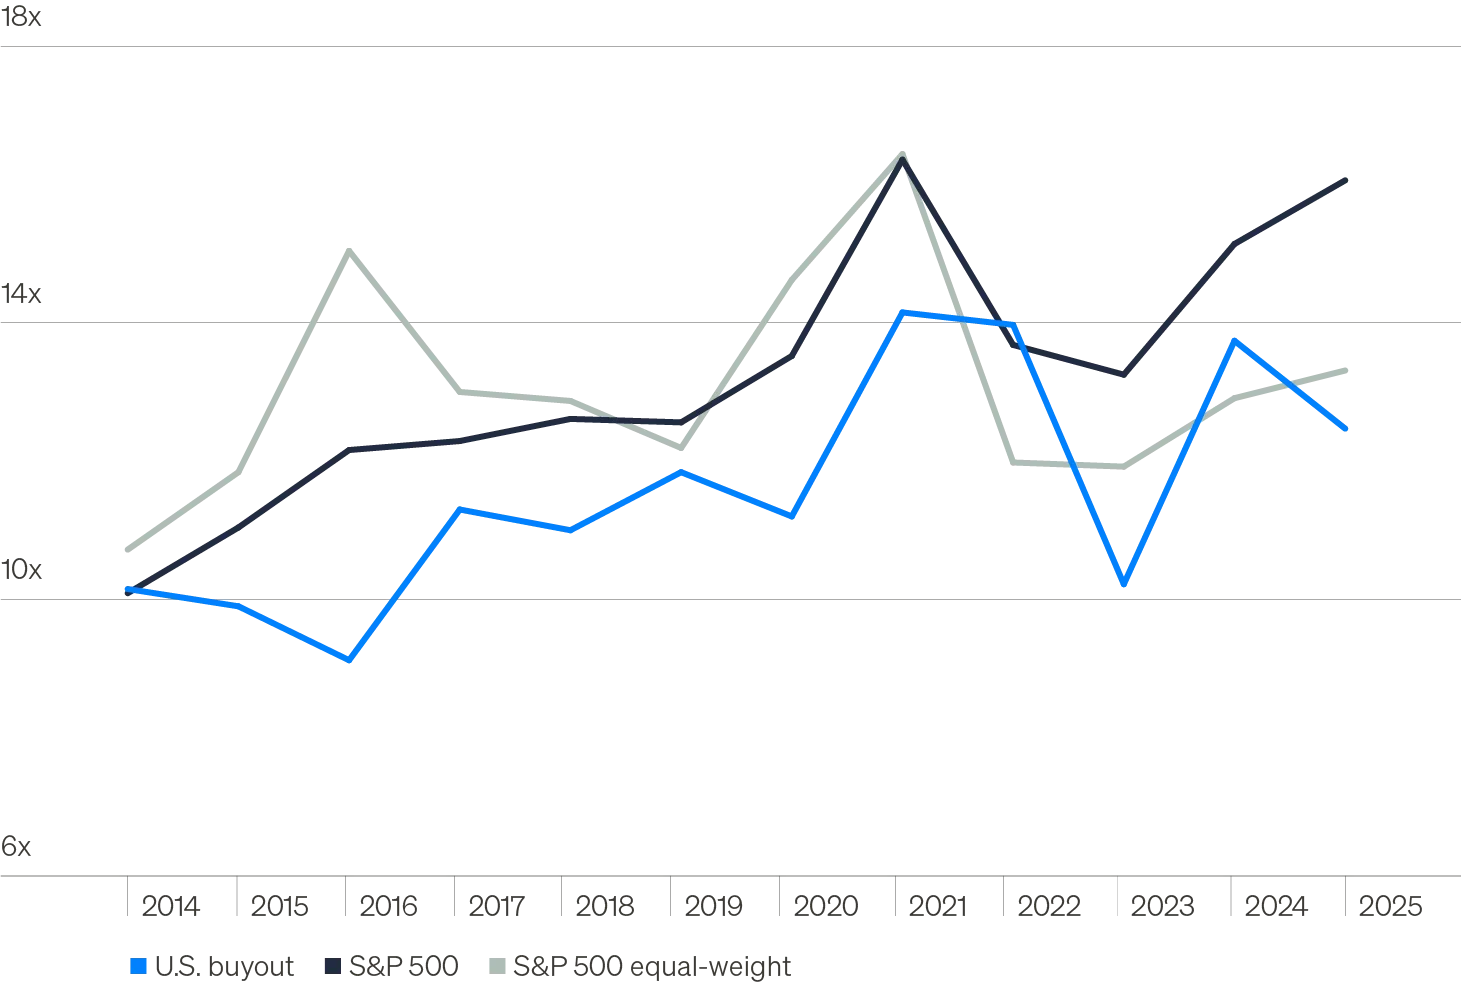
Source: Bloomberg, Pitchbook, as of September 30, 2025, latest data available. Public multiples represent annual averages of monthly data. Valuations metric refers to enterprise value (EV) to earnings before interest, taxes, depreciation, and amortization (EBITDA).

Today’s chart of the week highlights a key trend impacting private markets today. Explore this insight and more in our 2026 private markets outlook: Forged, not found: Selectivity shapes outcomes as momentum builds.

  • After three years of private equity lagging tech-driven public markets, today’s entry point in private equity offers compelling value.
  • Using U.S. buyout funds as a proxy, private equity valuation multiples currently stand at 12.5x versus 16.1x for the S&P 500. Even after adjusting for the elevated valuations of high-flying technology/AI hyperscalers, private equity valuations appear attractively valued relative to the equal-weighted S&P 500 of 13.3x.1
  • A healthy economic backdrop, easing policy uncertainty, and lower rates provide a tailwind to private equity deal activity and performance. But selectivity is increasingly critical as capital has crowded in to the largest deals and funds.
  • As competition intensifies in large-cap buyouts, alpha opportunities are more likely to be found in lower and core middle markets, where entry valuations are lower and information asymmetries persist.
contributing authors
Christopher Bole
Christopher Bole
Vice President, Financial Writer
footnotes + disclosures
  1. Bloomberg, Pitchbook, as of September 30, 2025, latest data available. Public multiples represent annual averages of monthly data. Valuations metric refers to enterprise value (EV) to earnings before interest, taxes, depreciation, and amortization (EBITDA).

The chart of the week and any accompanying data is for informational purposes only and shall not be considered an investment recommendation or promotion of Future Standard or any Future Standard fund. The chart of the week is subject to change at any time based on market or other conditions, and Future Standard and FS Investment Solutions, LLC disclaim any responsibility to update such market commentary. The chart of the week should not be relied on as investment advice, and because investment decisions for the Future Standard funds are based on numerous factors, may not be relied on as an indication of the investment intent of any Future Standard fund. None of Future Standard, its funds, FS Investment Solutions, LLC or their respective affiliates can be held responsible for any direct or incidental loss incurred as a result of any reliance on the chart of the week or other opinions expressed therein. Any discussion of past performance should not be used as an indicator of future results.

This information is educational in nature and does not constitute a financial promotion, investment advice or an inducement or incitement to participate in any product, offering or investment. Future Standard is not adopting, making a recommendation for or endorsing any investment strategy or particular security. All views, opinions and positions expressed herein are that of the author and do not necessarily reflect the views, opinions or positions of Future Standard. All opinions are subject to change without notice, and you should always obtain current information and perform due diligence before participating in any investment. Future Standard does not provide legal or tax advice and the information herein should not be considered legal or tax advice. Tax laws and regulations are complex and subject to change, which can materially impact any investment result. Future Standard cannot guarantee that the information herein is accurate, complete, or timely. Future Standard makes no warranties with regard to such information or results obtained by its use, and disclaims any liability arising out of your use of, or any tax position taken in reliance on, such information.

Any projections, forecasts and estimates contained herein are based upon certain assumptions that the author considers reasonable. Projections are necessarily speculative in nature, and it can be expected that some or all of the assumptions underlying the projections will not materialize or will vary significantly from actual results. The inclusion of projections herein should not be regarded as a representation or guarantee regarding the reliability, accuracy or completeness of the information contained herein, and neither Future Standard nor the author are under any obligation to update or keep current such information.

All investing is subject to risk, including the possible loss of the money you invest.