

Executive summary
U.S. bonds endured their seventh-worst quarter on record in Q3 as markets internalized a structural reality: A more competitive world is a costlier one. Governments and businesses are spending aggressively to secure strategic advantages in manufacturing, defense, resource resilience and artificial intelligence. This is making capital scarcer relative to the scale and urgency of investment needs, while increasing the frequency of supply disruptions. The most visible cost is higher interest rates.
The story of the third quarter was a dramatic increase in long-term Treasury yields. Most of that move can be explained by a shift in expectations for future Federal Reserve policy rates, as the economy’s performance has clarified policy was not sufficiently restrictive to guide inflation back to 2%. There is no evidence of a credibility crisis at the Fed, nor an un-anchoring of long-term inflation expectations. Fiscal sustainability concerns could certainly be contributing, but do not appear to be the proximate cause.
More broadly, the repricing of interest rates is a flashing signal that capital markets have entered a more competitive regime. The U.S. government will issue well over $2 trillion in net new Treasuries this year; a decade ago they issued jut $700 billion. Net corporate issuance could approach $1 trillion this year, around 30% of which is AI-related. Much of this demand for capital is relatively price-inelastic—the federal budget must be funded, while leading technology companies increasingly view AI infrastructure as a strategic imperative.
Markets have therefore moved from a period of price-insensitive capital supply, typified by the “Global Savings Glut,” toward one of price-insensitive capital demand. As capital needs rise relative to available supply, it is natural the price of capital should rise as well.
U.S. annual net new capital formation
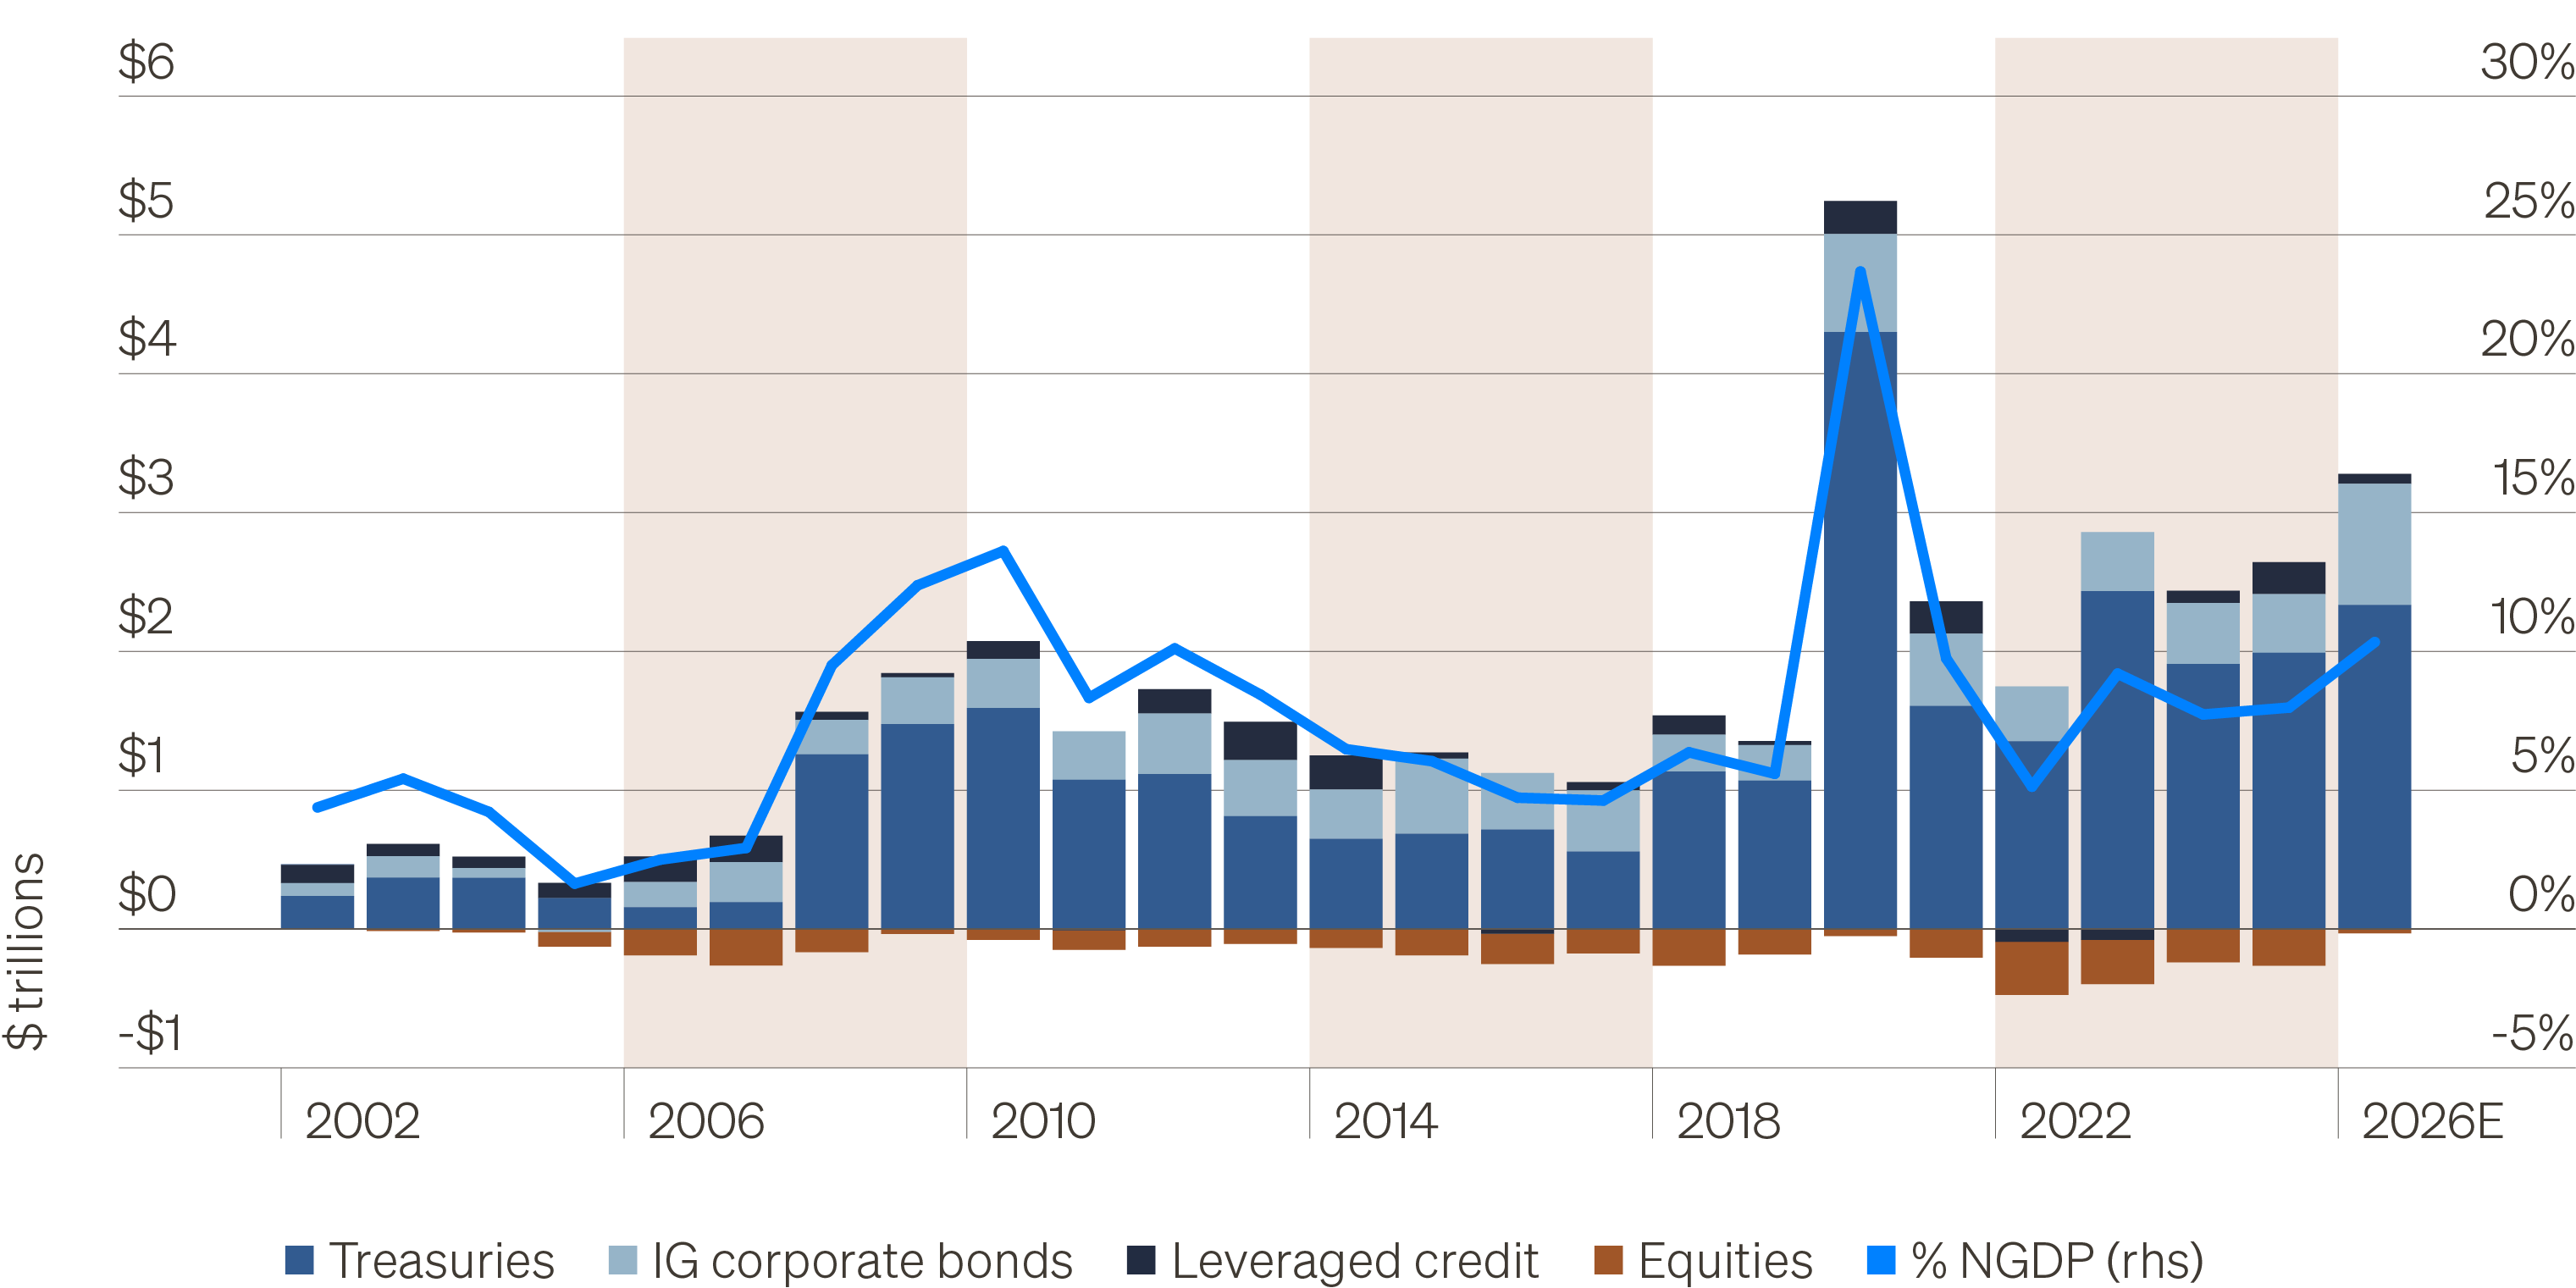
The growing competition for capital reflects intensifying competition across strategic arenas. Economic rivalry spurs industrial policy and incentivizes businesses to prioritize resilience over efficiency. Growing geopolitical conflict is driving an increase in global military expenditure, which had fallen for decades as a percentage of global GDP. Meanwhile, the race between the U.S. and China for technological supremacy has catalyzed massive investment in data centers and related infrastructure. All of this is expensive and must be funded, implicitly or explicitly.
All else equal, a high-competition regime will entail higher nominal growth and higher interest rates. Because more investment is being driven by strategic urgency rather than price signals alone, it will also carry greater risks of capital misallocation and other left-tail outcomes. The perception held by both the U.S. and China of an existential AI race increases the risk of both capital misallocation and adverse safety events, with the latter moving sharply into public consciousness in recent months.
Applying this lens to the rest of 2026 produces four key investor-relevant macro takeaways.
- Rates are not “too high.” The 2010s were an anomaly in which a glut of global saving met a paucity of productive investment opportunities, driving yields well below the rate of economic growth. That disconnect has been closed, and real yields are in line with the rate of real GDP growth—a historically normal relationship. Risk assets have been resilient through rising yields, suggesting markets see this as a reflection of strong growth, not a policy mistake. Yields could certainly decline in the near term, but their current level is not obviously out of step with economic fundamentals.
- The U.S. economy is less rate-sensitive—not rate-proof. Households and businesses each demonstrate healthy balance sheets, most homeowners hold fixed-rate mortgages, and AI-related spending appears less cyclical than traditional business investment. Each of those buffers suggests the economy can weather the rapid shift in yields. But certain areas of the economy—housing, commercial real estate, traditional business investment and low-income households—remain susceptible to financing costs. The wild card remains equity markets, which have played a role in sustaining strong business and household spending. Rates have risen meaningfully, but financial conditions have remained generally loose, thanks to the resilience of risk assets. A shift on that front would produce more meaningful risks to growth.
- The set of perceived AI risks has changed. The past few months have broadened the risks investors must consider around the AI theme. As we wrote in our recent report, Hidden Layers, the average investor holds roughly 25%–30% of their portfolio in assets directly tied to AI outcomes. Until recently, the central risk to those assets was monetization: Future profits would fail to justify today’s massive investment. The emergence of AI safety into the political zeitgeist, accelerated by real-world incidents, has added a meaningful second risk. A sufficiently serious event could provoke backlash and an aggressive regulatory response, creating confusion and uncertainty, potentially impairing AI-related assets before the monetization question is resolved.
- The midterms will likely deliver a divided government. Republicans have controlled the presidency and both houses of Congress over the past 21 months. With Democrats favored to win the House and increasingly competitive in the Senate, the November midterms are likely to produce some form of divided government. That would constrain the legislative agenda but not necessarily mean total inactivity. Instead, it would encourage greater reliance on executive authority and intensify competition between the parties to plant their respective flags on industrial, trade and AI policy ahead of the next presidential election. This could create uncertainty and volatility as both parties seek political advantage through populist policies that appeal to voters but introduce new risks for businesses and investors.
We will now review our outlook for key segments of the U.S. economy.
Consumers: Wealthy and spending
Real household consumption has risen at an annualized rate of 3.9% over the past six months, the strongest pace since 2024, despite real wage growth slipping into negative territory. Consumers have been buoyed by substantial asset wealth, allowing the saving rate to fall to 4.1%—its lowest level since 2008 outside the period immediately following the pandemic. In the aggregate, households appear well-suited to weather a Fed rate hiking cycle. Leverage is low, borrowing has not been the primary funder of strong recent spending, and higher short-term rates now generally produce a roughly equivalent rise in interest cost and interest income. The negative impacts, of course, will be skewed toward those who borrow more and own fewer assets.
Consumption growth did weaken the last time the Fed began raising rates in 2022, but that was in the context of pandemic-era base effects, a much larger rate increase than is projected currently, and an equity bear market. Given the sound footing of U.S. households, the primary risks from higher interest rates are not the direct effects, but rather any knock-on impacts to employment and the equity market, which has become an increasingly important macro variable.
U.S. real household spending growth
6-month annualized growth rate

Business investment: AI sets the floor, rates set the ceiling
Business investment continues to be powered by an inexorable rise in AI-related capital spending, but has this year begun to broaden out following Fed rate cuts and strong earnings results. Sharp weakness remains present in structures excluding data centers, largely explained by soft spending on commercial real estate construction and a reduction in manufacturing spending following the CHIPS and Science Act boom. In this way, the health of business investment can be trifurcated: Strong in AI-related sectors (40% of total spending), weak in rate-sensitive structures (15%) and modest but improving in the rest (45%).
Two actions we are reasonably confident about are that the rise in short- and long-term yields will drive continued weakness in rate-sensitive investment, and AI-related spending will persevere absent some left-tail outcome. The uncertain piece is more traditional industrial and transportation equipment, which benefits at the margin from AI spending but remains exposed to the broader economic cycle. One item to watch will be the continued impact of tariffs, as the tailwind from summer refunds end and new levies likely to be announced. We expect overall business spending to remain strong, but the move in rates could cap upside momentum in non-AI segments.
U.S. business fixed investment growth
% year over year

Housing: The lock-in effect is holding, for now
The housing market has been frozen for the better part of the past four years, and the recent uptick in mortgage rates toward 7.5% will only further entrench the affordability-driven demand weakness. Fewer than 5% of the national housing stock is transacting annually, a historically low number that underscores record-low household mobility. Residential construction is set to detract from GDP growth for the fourth year in the past five. But the resilience of home prices has kept the prolonged weakness in housing from creating broader knock-on wealth effects for households.
The mortgage lock-in effect has so far kept for-sale supply low enough to keep prices from falling meaningfully. The risk to that backdrop is that homeowners gradually abandon the hope that mortgage rates will return anywhere near pandemic-era levels, and real-life motivations to transact begin to outweigh financial ones. The recent rise in mortgage rates will likely suppress transactions further in the near term, but if sustained it could eventually catalyze a moderate decline in home prices.
Higher mortgage rates will further challenge housing

Labor market: Solid, not overheating
The labor market has improved in 2026 relative to the second half of 2025, though its strength should not be overstated. Job growth has improved but is still unevenly distributed, the unemployment rate has fallen modestly compared to one year ago and layoffs remain historically low. It is clear the fundamentals of the labor market remain supportive of broad economic growth, and the Fed Chair Kevin Warsh stated explicitly that he believes the labor side of the Fed’s mandate is in “good shape.”
Wage growth remains the key outlier. Average hourly earnings have moderated this year, despite a lower unemployment rate, but much of that slowdown reflects unusually weak wage growth in the health and education sectors (which, oddly, also account for roughly 60% of this year's job gains). If we isolate the labor-intensive services industries with the clearest connection between labor costs and prices, wage growth has accelerated over the past year. The labor market is stable rather than overheated, but wage pressures in key service industries still remain inconsistent with a smooth return to 2% inflation.
U.S. average hourly earnings, % year over year
Production and non-supervisory workers

Inflation: No easy path to 2%
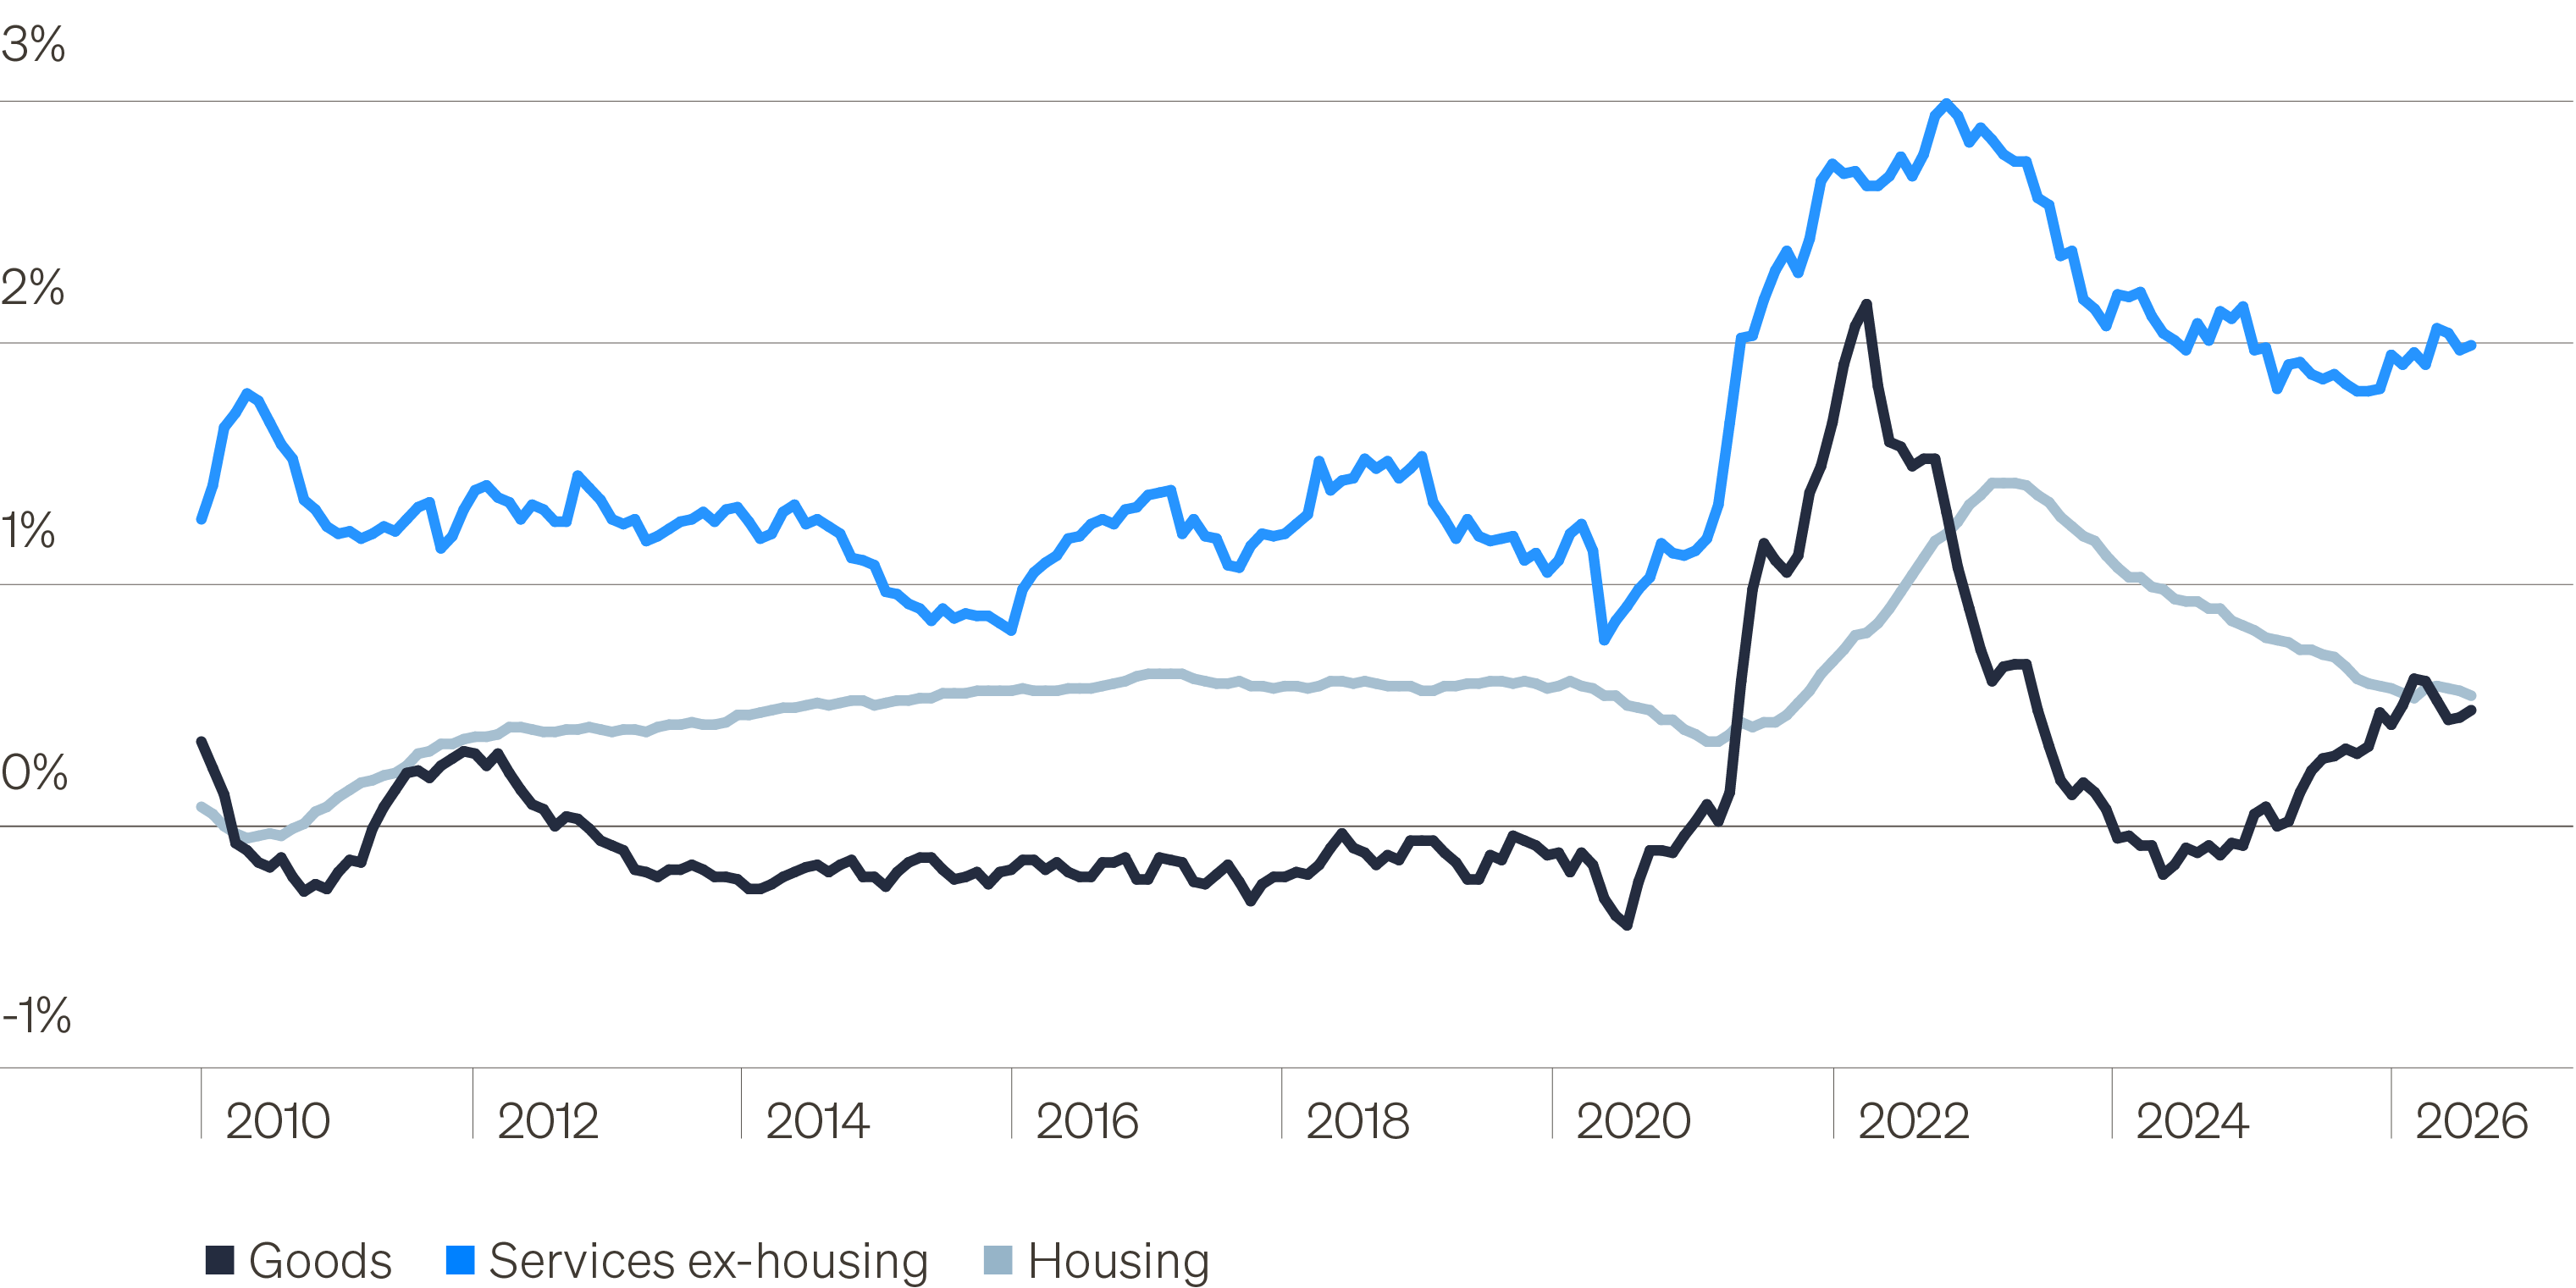
Inflation data has improved somewhat in recent months, but that has not changed the overarching narrative materially. Underlying core inflation continues to run near 3%, reflecting minimal progress toward the 2% target since early 2024. The composition of excess price growth has changed since then: Rising goods inflation has offset cooling housing inflation, while core services continue to run about 1.5 percentage points higher than pre-COVID levels.
Some of today’s inflation can reasonably be attributed to supply-side disruptions ranging from tariffs to AI-related component shortages. But the reality remains that inflation has been above target for 5.5 years, consumption remains robust, capital spending looks to be broadening and the frequency of supply shocks is likely to be durably higher going forward. Core inflation no longer appears to be worsening. But competition for capital, resilient demand and more frequent supply disruptions do not describe an environment in which inflation should naturally fall back to 2%.
Contributions to year-over-year change in core PCE
Fed/interest rates: Policy reflects economic reality
The market has moved from expecting 60bps of rate cuts in 2026 at the start of the year to pricing 50bps of cumulative rate hikes. That 110bps swing would be the second-largest hawkish repricing of the past 22 years, exceeded only by 2022. The 10-year Treasury yield has risen by nearly the same amount. The near one-for-one repricing of policy expectations and long-term yields, combined with resilient risk assets, suggests investors increasingly accept that stronger growth and more persistent inflation warrant a higher cost of capital. We agree. By international standards, the U.S. remains well-positioned, with long-term borrowing costs broadly in line with its pace of economic growth rather than materially above it.
The market now expects one more hike this year, followed by 50bps of tightening in 2027, which it believes will drive inflation to a still-above-target level of 2.5%. This seems a low bar. If inflation remains above target and economic growth stays strong, policy pricing could turn more hawkish through year end, putting additional upward pressure on long-term yields. On the other hand, a meaningful tightening in financial conditions, particularly through lower equity prices, could cause the Fed to pause. The sharp rise in yields reflects policy moving into alignment with underlying growth. The Fed is likely to hike once in Q4, setting up a high-stakes policy environment in 2027 as the Fed operates from closer to neutral.
Global nominal 10-year yield vs. nominal GDP growth
