between the tackles

In football, there are times when simply lining up and running the ball can move the chains. But as defenses adjust, success increasingly depends on finding the right matchup, identifying the opening, and exploiting it. Our 2026 Midyear Private Markets Outlook examines how private markets have entered a comparable regime, one where broad asset class exposure alone may be less important than selectivity across strategies, segments, and managers.
The first half of the year proved eventful as renewed conflict in Iran, a stubborn re-acceleration in inflation, and a sharp repricing of software assets stalled the dealmaking momentum that had carried into the year. Yet beneath the turbulence, the underlying trajectory remains intact. The economy expanded at a solid 1.8% annual pace in the first half, portfolio companies continue to grow, and credit is performing. The pause, in our assessment, marks an interruption to this cycle rather than a disruption of it.
What has shifted is structural. Higher rates and elevated valuations have retired the financial tailwinds that underwrote theprior cycle, namely cheap leverage and reliable multiple expansion. At the same time, as capital gravitates toward AI and an increasingly concentrated cohort of perceived winners, return dispersion has narrowed between asset classes and diversification has become harder to find. Simply lining up behind a favored asset class may no longer be enough. Increasingly, returns are being shaped by where investors deploy capital within an asset class and with whom. That is the through-line of the pages that follow: a market where selection, not allocation alone, is increasingly driving outcomes.
Our Midyear Outlook is constructed around the four pillars of a modern private markets allocation: private equity, private credit, real estate and infrastructure. Within each, we assess the trajectory of the asset class and distill the investment themes we believe warrant the greatest conviction heading into the second half.
We hope our 2026 Midyear Private Markets Outlook offers both clarity and conviction, and we invite you to subscribe to our research to stay informed on the forces shaping private markets today.

Explore the opportunities, risks and market dynamics we believe investors should be watching in the second half of 2026.
defining trends
A CYCLICAL REBOUND
—WITH A TWIST
Capital Concentration is reshaping markets
AI IS EATING THE WORLD
THE PRIVATE CREDIT DIVIDE
PRIVATE EQUITY
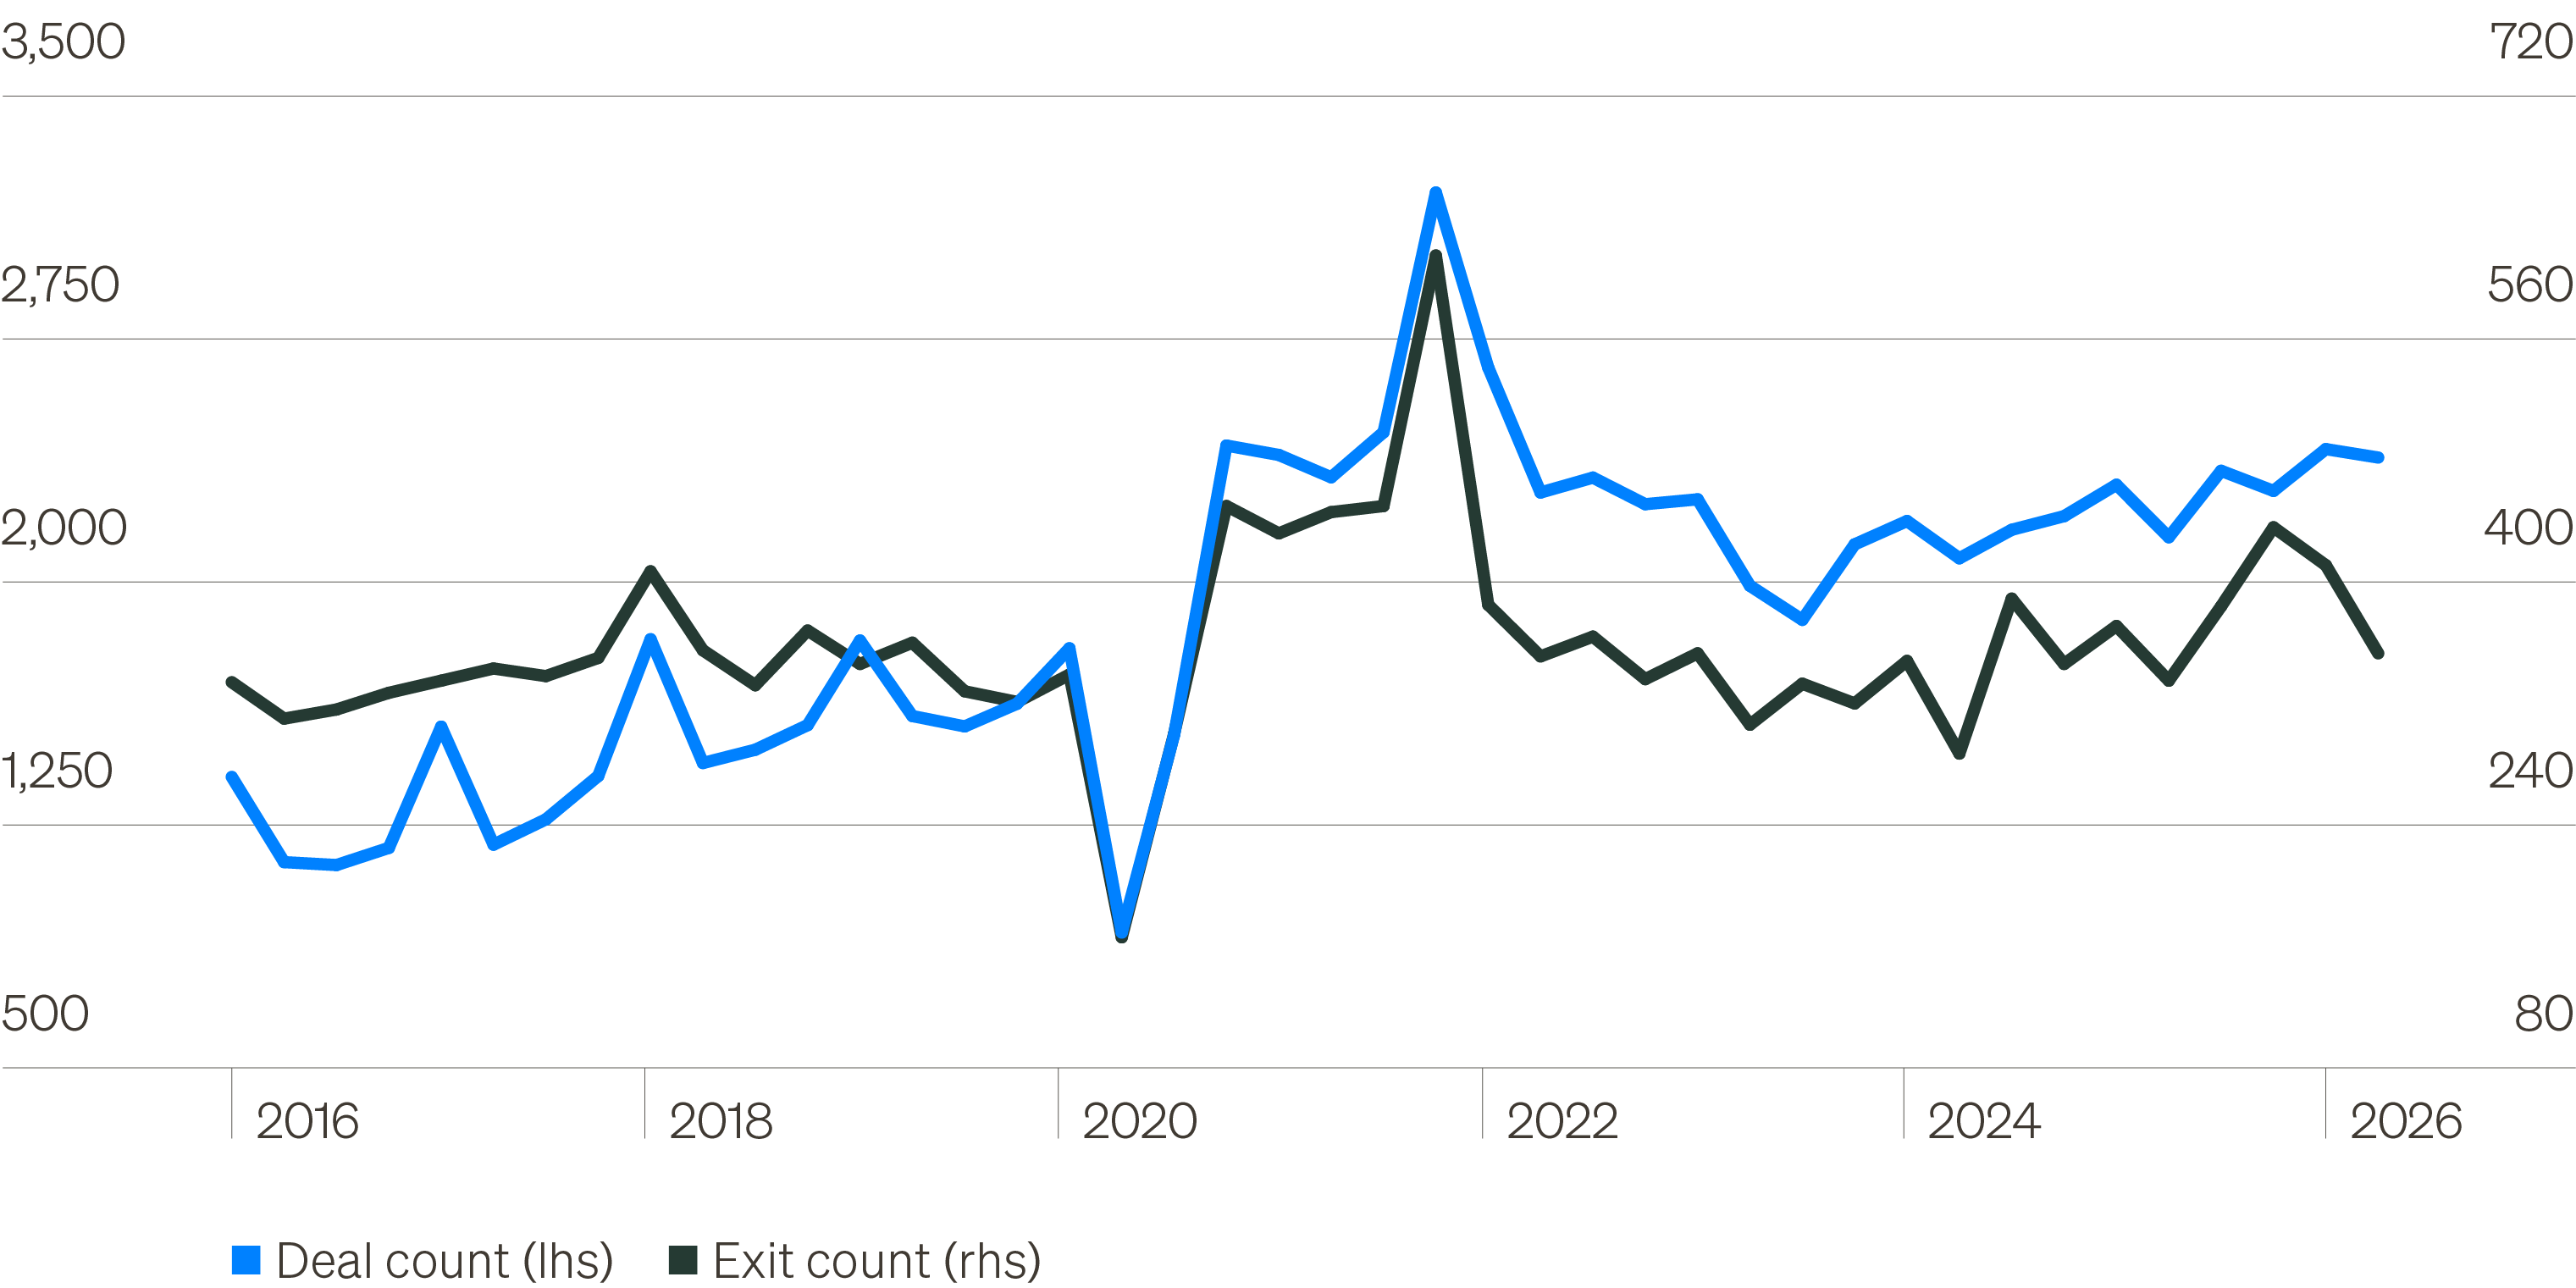
The megadeals that dominated the second half of last year faded, driven by significantly reduced volume in software and the broader tech sector. The fact that deal count continued to rise, despite this, is an optimistic signal for broadening deal activity if macro uncertainty fades.
After an acceleration in both exit count and value last year, realization activity moderated in Q2 as uncertainty surrounding the Iran war and inflation put buyers—and especially strategics—on hold. Exit valuations fell below where sponsors had assets marked for three years, but that gap has now fully closed. This should prompt more sponsors to bring assets to market once macro uncertainty clears. Still, we do not expect a deluge—high-quality assets will fetch premium prices, while lower-quality aging inventory will continue to challenge the industry.
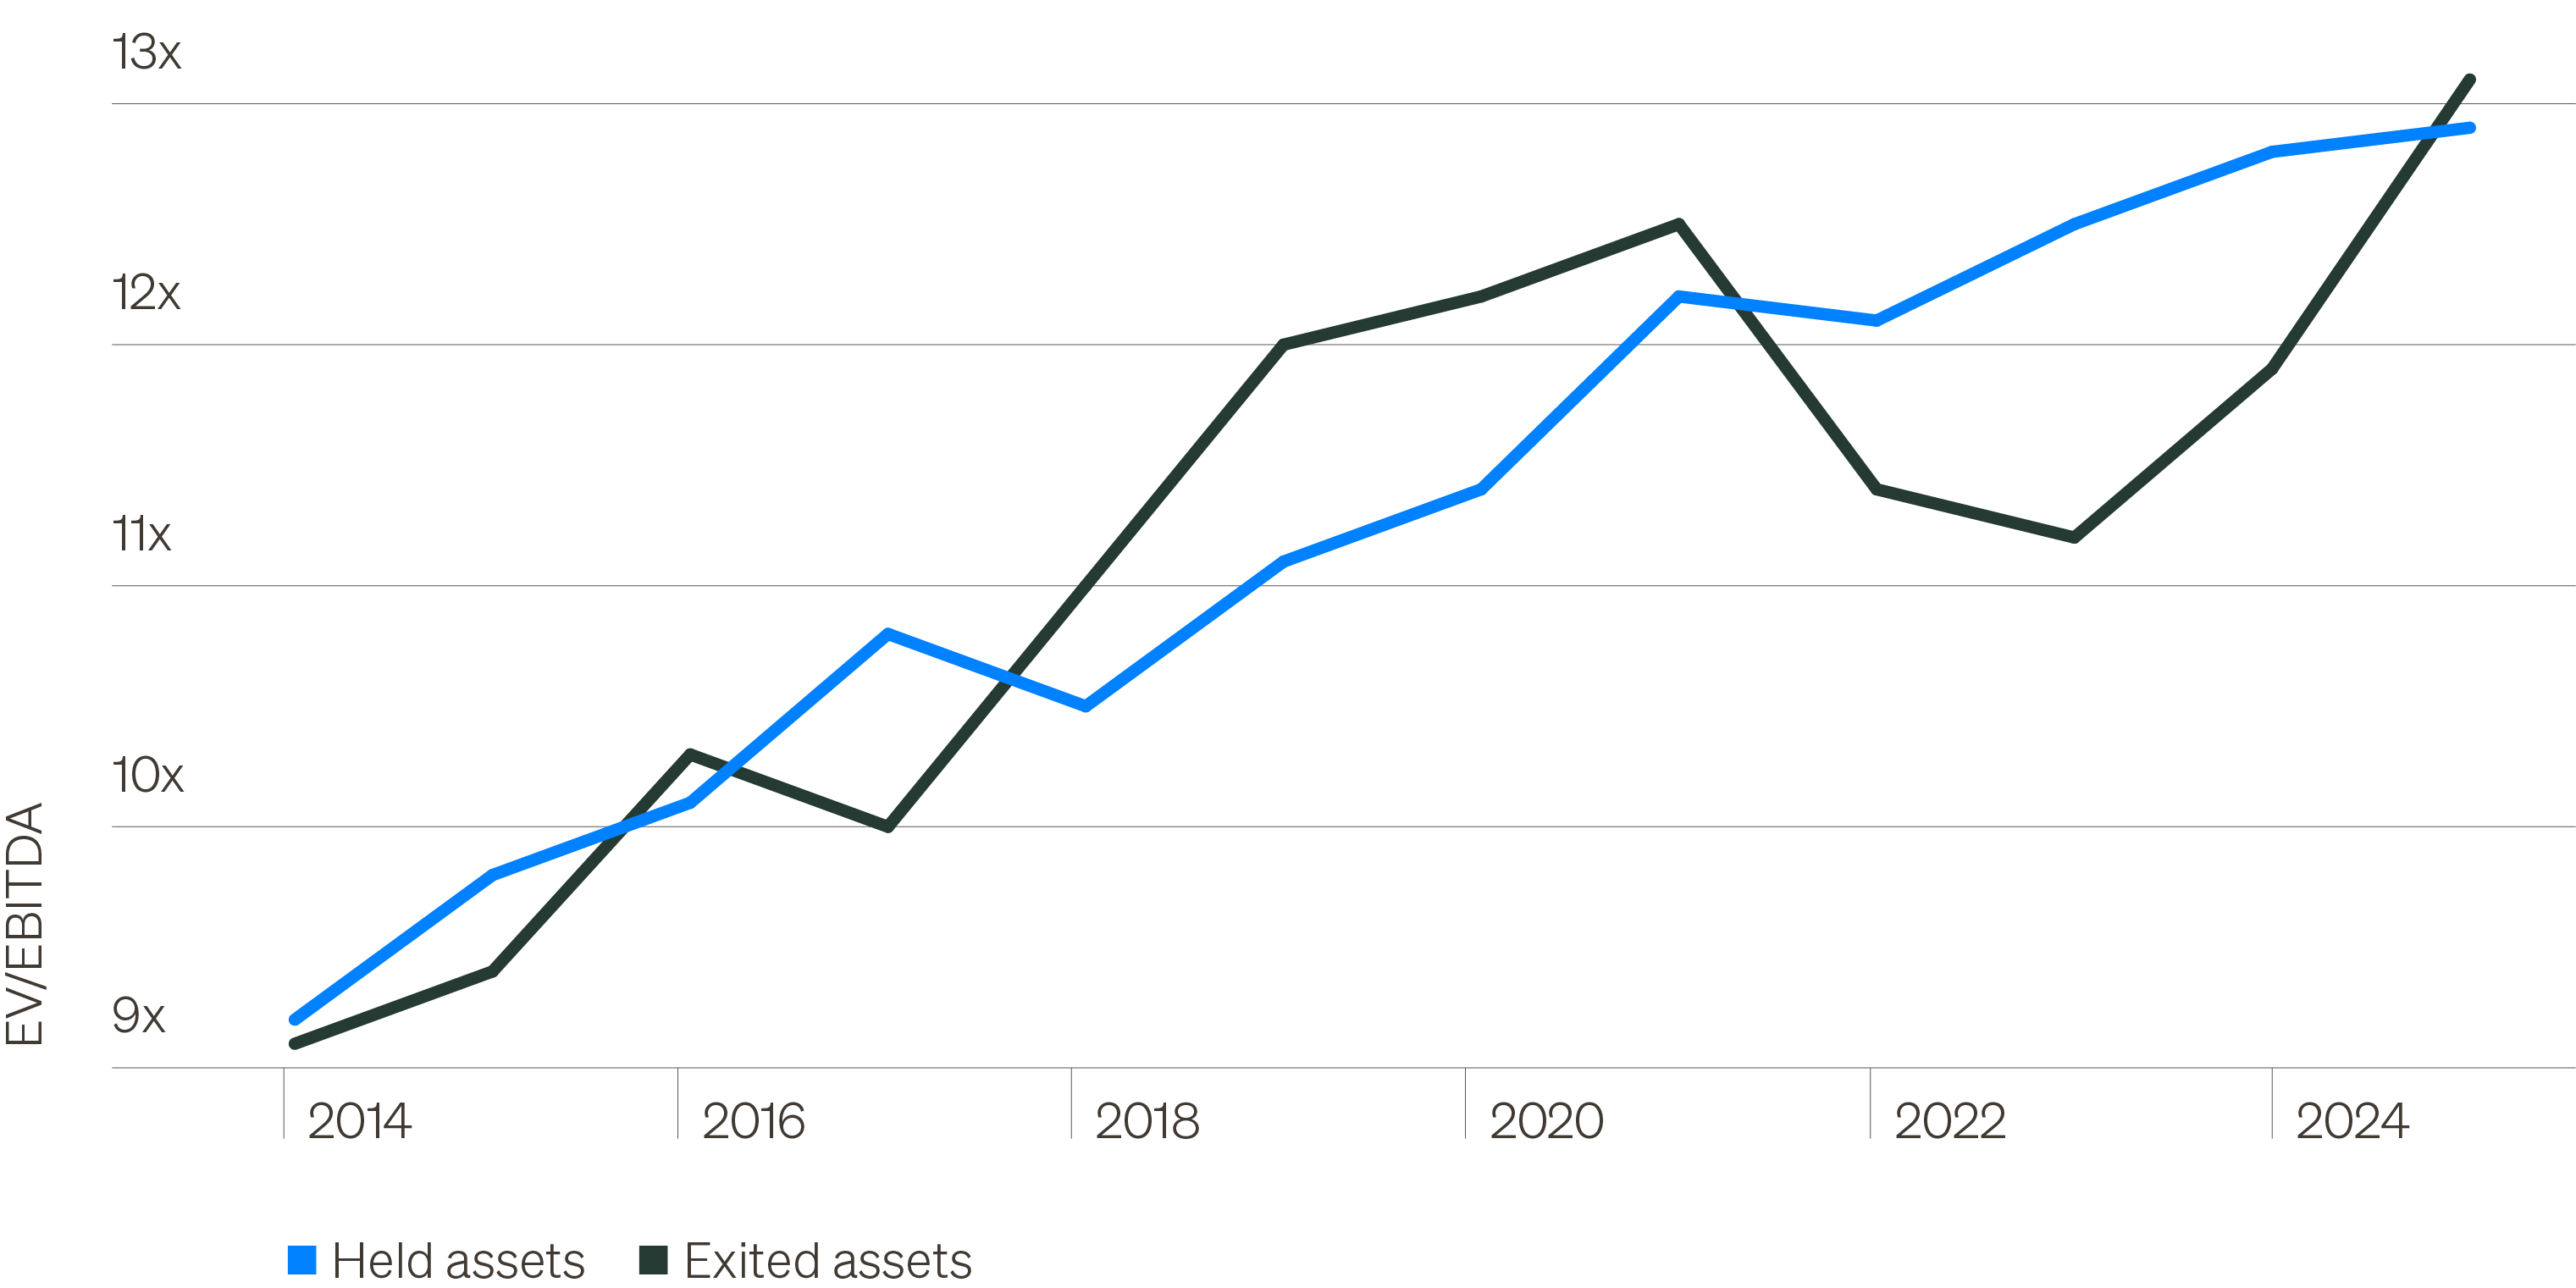
Fundraising data continue to play into our broader theme: Selective LPs are concentrating commitments into the largest strategies. The 10 largest funds collected 48% of all PE capital during the first half, up from 40% in 2025 and an average of 37% since 2020.1 Inflated fund sizes have pushed these sponsors toward larger deals, widening the range of entry multiples across the industry. The delta between the median middle market deal (10.4x) and the median billion-dollar deal (14.4x) has nearly quadrupled over the past decade, a symptom of increased competition at the top end of the market.2 With software deal activity slowing, deployment pressure may increasingly spill into other sectors.
These trends are playing out amid a tectonic shift in how private equity sponsors drive returns, and within a broader financial market landscape faced with profound concentration risks. After a decade in which low borrowing costs and reliable valuation expansion offered managers a healthy margin of safety, the regime emerging alongside this new cycle will be less forgiving. Deals will succeed or fail based on the ability of the sponsor to drive operational improvements that lead to excess earnings growth. AI implementation provides a powerful new tool in this pursuit, while also threatening disruption for some industries. Combined with the emergent gaps being driven by capital concentration, dispersion is set to rise—across managers, segments and assets. Private equity offers a compelling opportunity for investors to source growth outside the AI theme, which now comprises over half the S&P 500. The following themes explore where these forces are creating the best opportunities.
U.S. PE quarterly transaction activity
Source: Pitchbook, as of June 30, 2026.
U.S. buyout valuations: Holdings vs. exits
Source: MSCI, as of December 31, 2025.
Putting performance in perspective
Quantifying PE’s new era
Hard times for software
Secondaries are reshaping the market
PRIVATE credit
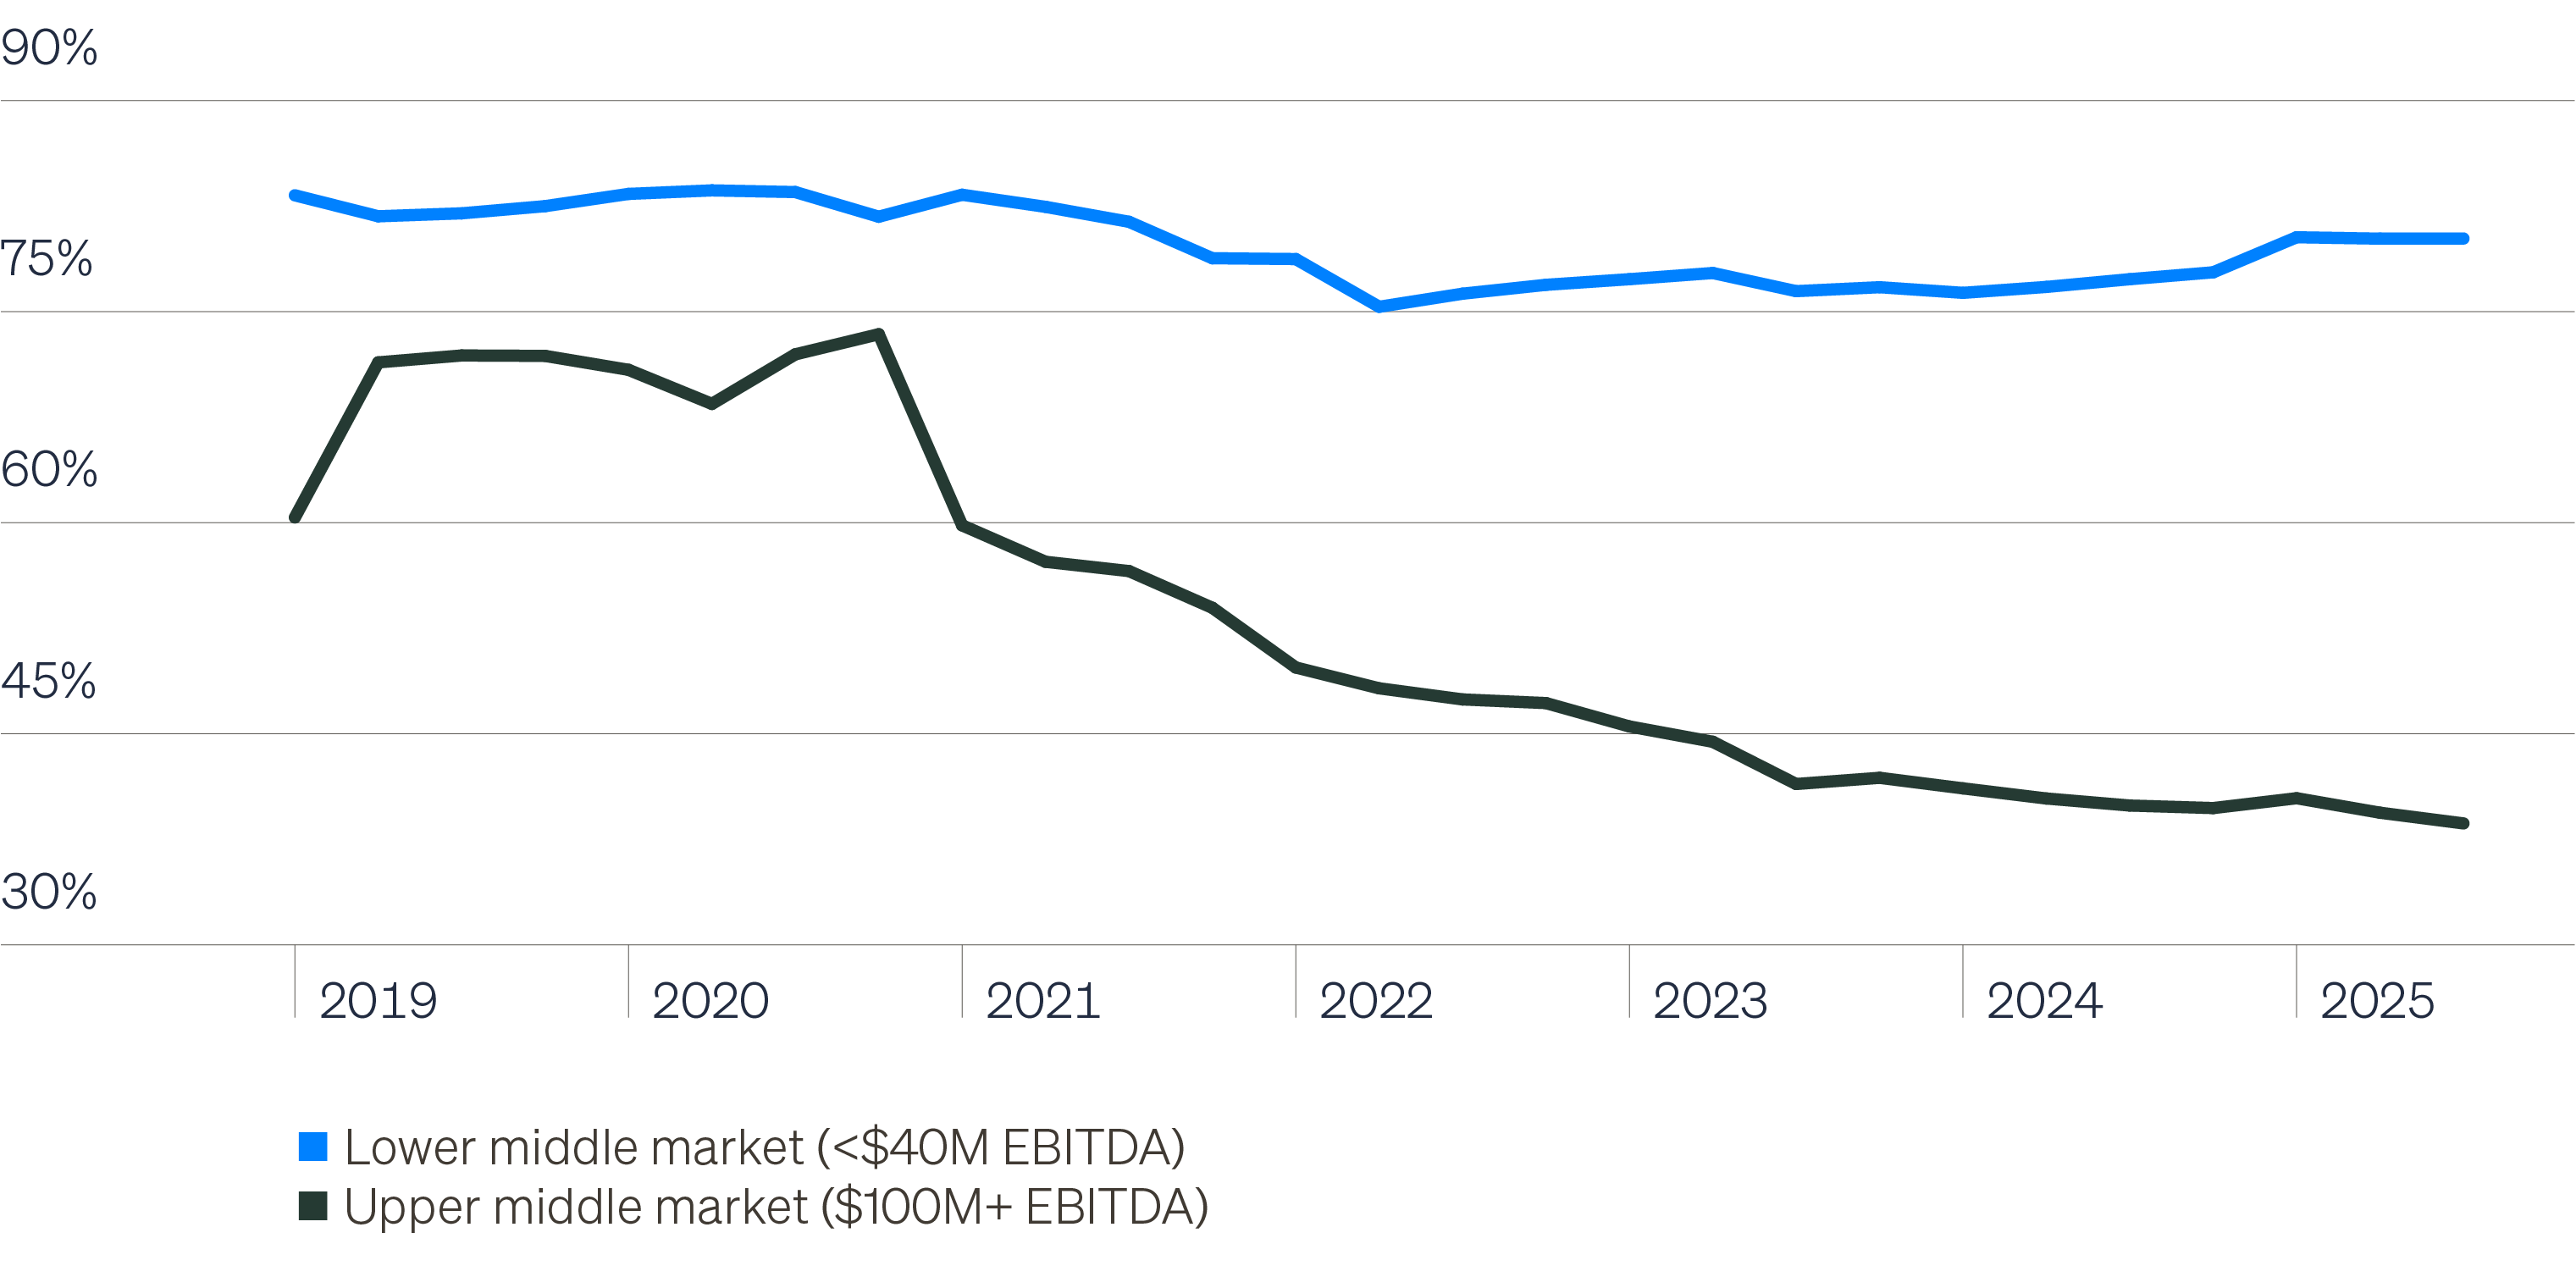
Broad market data point to spread compression, declining yields and moderating returns, but those numbers are highly influenced by the large-cap market segment. Large cap, sponsor-backed direct lending drove much of private credit’s recent growth as scaled lenders stepped in when the broadly syndicated loan (BSL) market was largely inactive and banks were reluctant to hold risk. Providing certainty of capital in that environment was a compelling advantage. Today, however, that advantage has become less meaningful as syndicated markets have been wide open since late 2024. What was once a differentiator is now a headwind—limiting pricing power and pushing loan terms toward public markets. Investors have taken notice.
As the top end of the market has become more challenged, attractive opportunities remain elsewhere. Core and lower middle market direct lending—as well as non-sponsored finance—continue to offer attractive spread premiums, while areas like asset-based finance and real estate credit may simultaneously accomplish income goals and enhance diversification. In these less crowded areas, alpha is supported by solving borrower needs that remain entrenched, accomplished through capital permanency, tailored solutions and financial disintermediation. These are tangible benefits for which borrowers are willing to pay a premium.
Such strategies often rely on specialized expertise and proprietary sourcing networks, executing deal sizes well below that of scaled private lenders and syndicated bank processes. As a result, managers can express a distinct skillset and market view in portfolio construction, rather than being takers of broad-based market volume. This allows more specialized managers to offer “something more” than income alone, and as shown, often provides portfolio solutions additive along both return and risk dimensions.
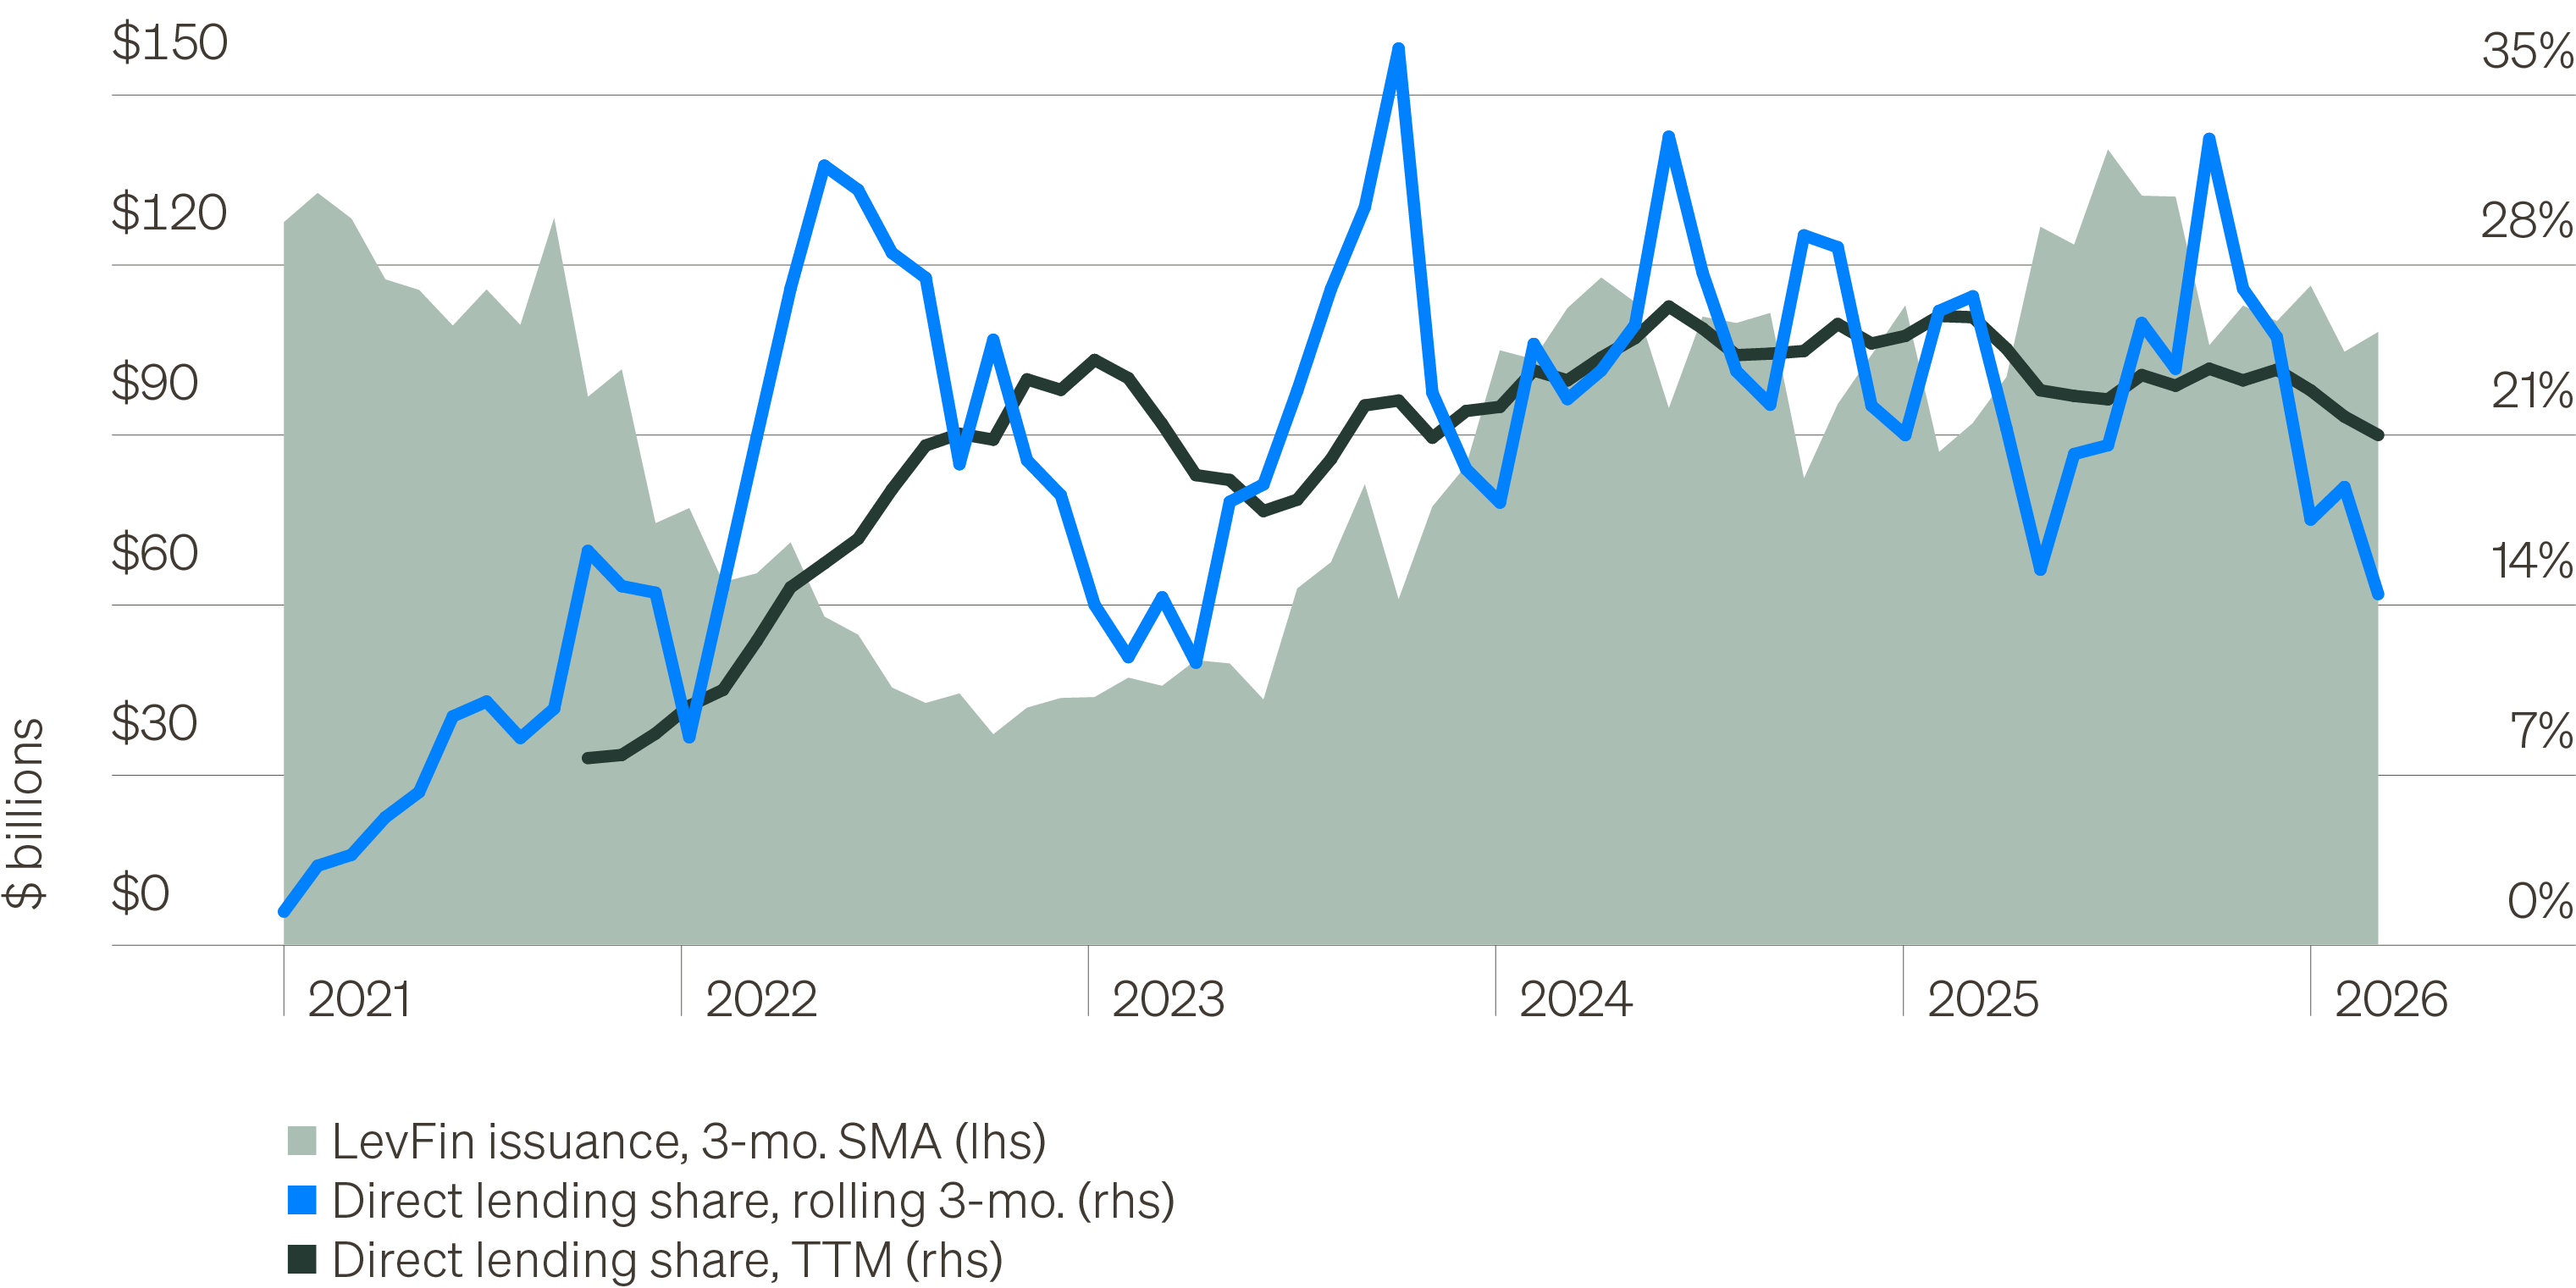
The past year has shown the BSL market is a fierce competitor—for deal flow, pricing and increasingly, on lender protections. Since peaking in August 2024, direct lending’s share of trailing 12 month (TTM) leveraged finance (LevFin) deal volume has consistently declined. TTM direct lending issuance is up just $4.5 billion since market share peaked, despite TTM aggregate LevFin issuance increasing by over $300 billion during the period.3,4
For the largest private credit lenders, whose deployment is contingent on successfully competing with the BSL market, this is clearly cause for concern. When the BSL market is open and active, routinely pricing new-issue loans at spreads of 275bps–325bps (as it is today), large private lenders are clear price takers, and deal-level economics quickly fall apart for investors (see Theme 1).
Through the remainder of the year, a resilient economy supportive of stable operating performance will likely mitigate distress with market returns proving tolerable, if suboptimal. We expect sentiment will gradually rationalize as dire headlines continue overshooting realized outcomes, with cautious optimism potentially returning later this year. Renewed interest following the current recalibration may be catalyzed as investors adopt strategies where the core purpose of private credit remains—translating borrower solutions into differentiated investor outcomes. To that end, we observe three fundamental questions at the heart of negative market sentiment and against which managers need to prove themselves to the market.
- Where do expected returns provide adequate compensation for the risk, illiquidity and expense of private credit? (Theme 1)
- If software remains challenged, and large lenders can no longer rely on software deals to absorb 30%–40% of deal flow, where does this money go? (Theme 2)
- How stable is the liquidity position of private credit funds? Can funds continue to perform in the face of elevated investor redemptions? (Theme 3)
Leveraged finance issuance trends
Private credit market share
Source: KBRA DLD, Pitchbook LCD, as of May 31, 2026.
Note: Leveraged finance issuance includes high yield bonds, broadly syndicated loans, and direct lending.
Share of unique issuers
By market segment
Source: Cliffwater, as of March 31, 2026.
Recalibrating return expectations
Where does the software money go instead?
Testing liquidity in private credit funds
commercial real estate
Transaction volume totaled $279 billion during the first half of the year, up 23% from the same period in 2025, while single-property sales—the best gauge of dealmaking momentum—rose 15%. Still, the acceleration that began in the second half of last year following Fed rate cuts has temporarily stalled, not unlike the pause that followed Liberation Day in spring 2025. The result is not a disrupted recovery, but an interrupted one.6
In our annual outlook, we identified four forces that would support a continued recovery in CRE activity; as the table on the following page shows, each remains broadly on track. That suggests the inconsistent pace of this cycle has less to do with deteriorating real estate fundamentals than with external pressure from rates, inflation, policy uncertainty and geopolitics.
Property price growth reflects this fragmented improvement. Overall values have risen 1.6% over the past year, in line with the rate of growth since the start of 2025.6 As we discuss in Theme 2, the dispersion between property types is rather narrow, with hotels the exception to the downside (largely a function of weakness in economy properties). Cap rates were flat-to-up in the first half depending on property type, leaving net operating income (NOI) growth as the primary driver of price appreciation.
The fundamental backdrop, however, continues to improve. The development wave that pressured multifamily and industrial markets is fading as slower rent growth, rising input costs and (most importantly) higher interest rates have curtailed new construction. What was a forecast in our annual outlook is increasingly becoming reality. Supply growth across most major property types is set to fall meaningfully over the coming several years, improving the balance between supply and demand. Public REIT NOI growth has already improved from 2.7% in Q3 2025 to 3.8% through Q1 2026, reflecting that shift.7 Data centers remain the one major exception, as the AI buildout has catalyzed a flood of capital.
The intermittent exogenous shocks that have defined the past few years have periodically interrupted—but not disrupted—the real estate rebound. Healthy demand combined with falling supply bodes well for rent growth, which should modestly boost property values next year. Interest rates remain a genuine headwind, but potential dissipation of geopolitical uncertainty—most importantly in Iran—would see momentum return even if yields stay elevated as we expect. More importantly, and as laid out in the themes that follow, investors must approach this cycle differently. Real estate’s role as an inflation-sensitive asset has become more valuable, but the financial tailwind that drove returns in the prior cycle is no longer present. In its place is an income-driven cycle in which opportunities extend across property types, metro areas and segments of the capital structure, but where fundamental underwriting and operating expertise are nonnegotiable.
U.S. CRE monthly transaction activity

Source: MSCI Real Capital Analytics, as of June 30, 2026.
Annualized CRE inventory growth

Source: CoStar, as of June 30, 2026.
Cap rate spreads portend modest appreciation
Dispersion: From sector-level to asset-level
Credit remains a compelling opportunity
infrastructure
Interest in infrastructure has intensified in recent years as governments, corporations and investors confront a growing need to modernize aging assets while building new capacity for a world that is becoming more digital, energy intensive and informationally connected. Long-term trends including population growth, urbanization, deglobalization, artificial intelligence, electrification and national security priorities are creating sustained demand for investment across infrastructure sectors. Recent estimates suggest that global infrastructure spending needs could exceed $100 trillion by 2040.8
Digital infrastructure is one of the fastest-growing and most capital-intensive infrastructure segments. An estimated $19 trillion will be needed by 2040 to build, maintain and operate the infrastructure that underpins the digital economy.8 Digital infrastructure forms the physical backbone of the digital economy, enabling the creation, storage, movement and security of data. These assets include data centers, fiber and broadband networks, wireless towers and connectivity platforms that support both consumer and business applications. Demand for these assets has grown exponentially in recent years, driven by cloud computing, artificial intelligence, 5G deployment and the proliferation of connected devices.
According to Statista, global data creation, capture and consumption is expected to increase from 173 zettabytes in 2025 to 528 zettabytes by 2029—more than tripling in just four years. For perspective, one zettabyte is equivalent to approximately 250 billion DVDs of data.
The growth of AI workloads, cloud computing and other data-intensive applications is reshaping the opportunity set for digital infrastructure. At the same time, rising energy demand and data sovereignty considerations are elevating the importance of power infrastructure and geographic location. These trends are blurring the traditional boundaries between infrastructure, energy, real estate and technology, mandating cross-disciplinary expertise for operators and investors within the space.
While investment projections vary, the direction of travel is clear. Supporting this expansion will require significant new capacity across data centers, power infrastructure, fiber networks and related assets, creating a broad and durable investment opportunity across the digital infrastructure ecosystem.
Global mobile network data traffic

Source: Ericsson. (1 exabyte = 1 billion gigabytes)
Aggregate AI capex estimates

Source: Goldman Sachs. “Tracking Trillions: The Assumptions Shaping the Scale of the AI Build-Out.”
Connecting the digital economy
The flexibility premium in digital infrastructure
Can we talk in private?
2026 Midyear Private Markets Outlook with Mike Kelly
In the first episode of Can We Talk in Private?, the new podcast from Future Standard, hosts Alan Flannigan and Andrew Korz sit down with Future Standard Chief Investment Officer Mike Kelly to share their views on the major themes driving private markets.


2026 Midyear Private Markets Outlook
Watch a replay of Andrew Korz, Senior Vice President, Investment Research, and Alan Flannigan, Vice President, Investment Research, discuss key themes from our 2026 Midyear Private Markets Outlook.