

Quantifying the middle market opportunity
Sizing up the opportunity in the U.S. middle market
The U.S. middle market has served as a driving force of the domestic economy for decades, representing one-third of private sector gross domestic product (GDP) and employing approximately 48 million people. It is highly diverse, spanning across industries and within sectors that are critical to our national physical, digital and social infrastructure, including manufacturing, construction, health care, capital goods and financial services. The vast majority of these companies are privately held, creating both opportunities and hurdles to access the return potential of investing in the middle market.
Figure 1: Middle market highlights
Public market opportunity has narrowed
Approximately 4% of U.S. companies are publicly listed, meaning most of the corporate growth—and investor opportunity—exists outside public markets.3 At the same time, public equity markets have become more concentrated, with market leadership and index performance driven by a narrower group of companies and sectors, making diversification more difficult for investors.
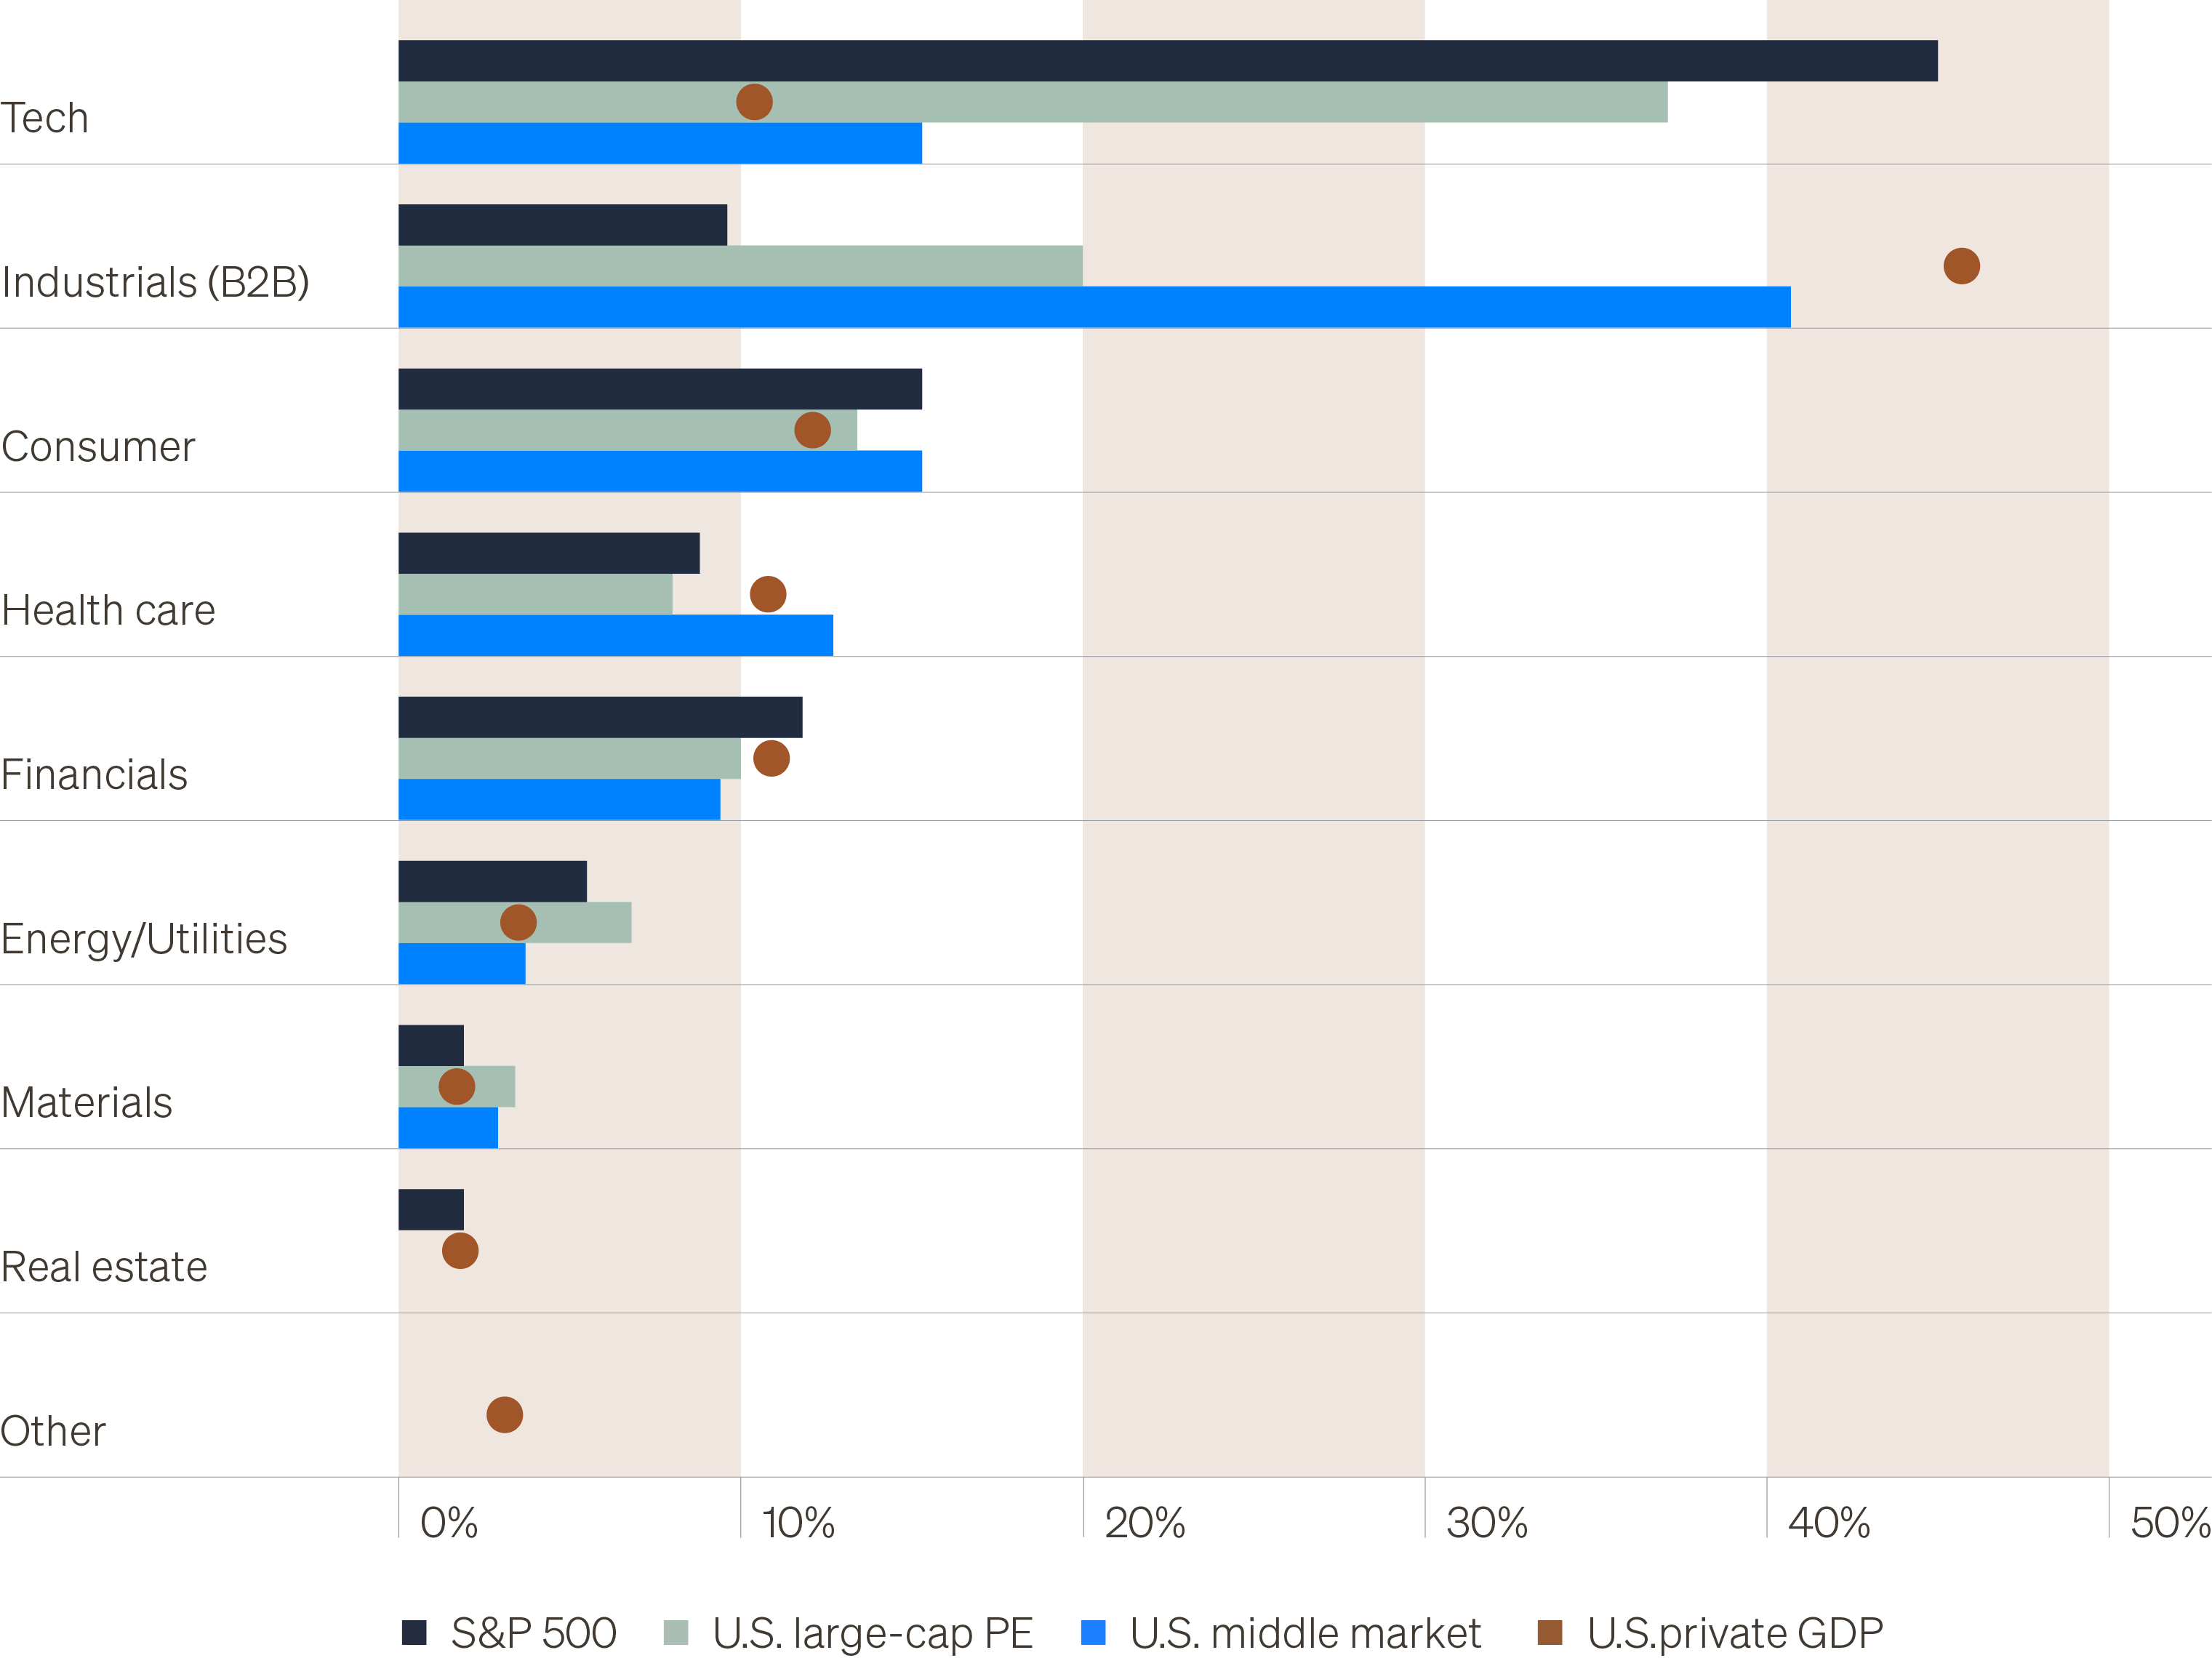
- Sector concentration Technology companies represent roughly one-third of the S&P 500’s market capitalization.
- Valuations The S&P 500 forward price-to-earnings ratio has been at or near historical highs for much of the last few years, suggesting future returns may be more dependent on earnings growth than multiple expansion.
- Performance imbalance A small group of large, technology-oriented companies have driven a meaningful share of overall market returns, leading to a more concentrated performance profile across the index.
The result is a market increasingly reliant on a narrower set of companies and sectors for performance. While these companies have delivered strong returns, this concentration reduces diversification and increases sensitivity to changes in growth expectations, interest rates or market sentiment.
The U.S. middle market offers
differentiated sources of growth
In our view, the U.S. middle market represents a compelling source of growth at more attractive valuations than public equities. Since many of these businesses are earlier in their growth trajectory, they have grown revenues faster than their public peers, driven by market share gains, operational improvements and geographic expansion.
With nearly 90% of revenue generated domestically (vs. approximately 60% for the S&P 500), these businesses are also typically less exposed to geopolitical and trade‑related risks.4
Figure 2: Revenue growth by market segment

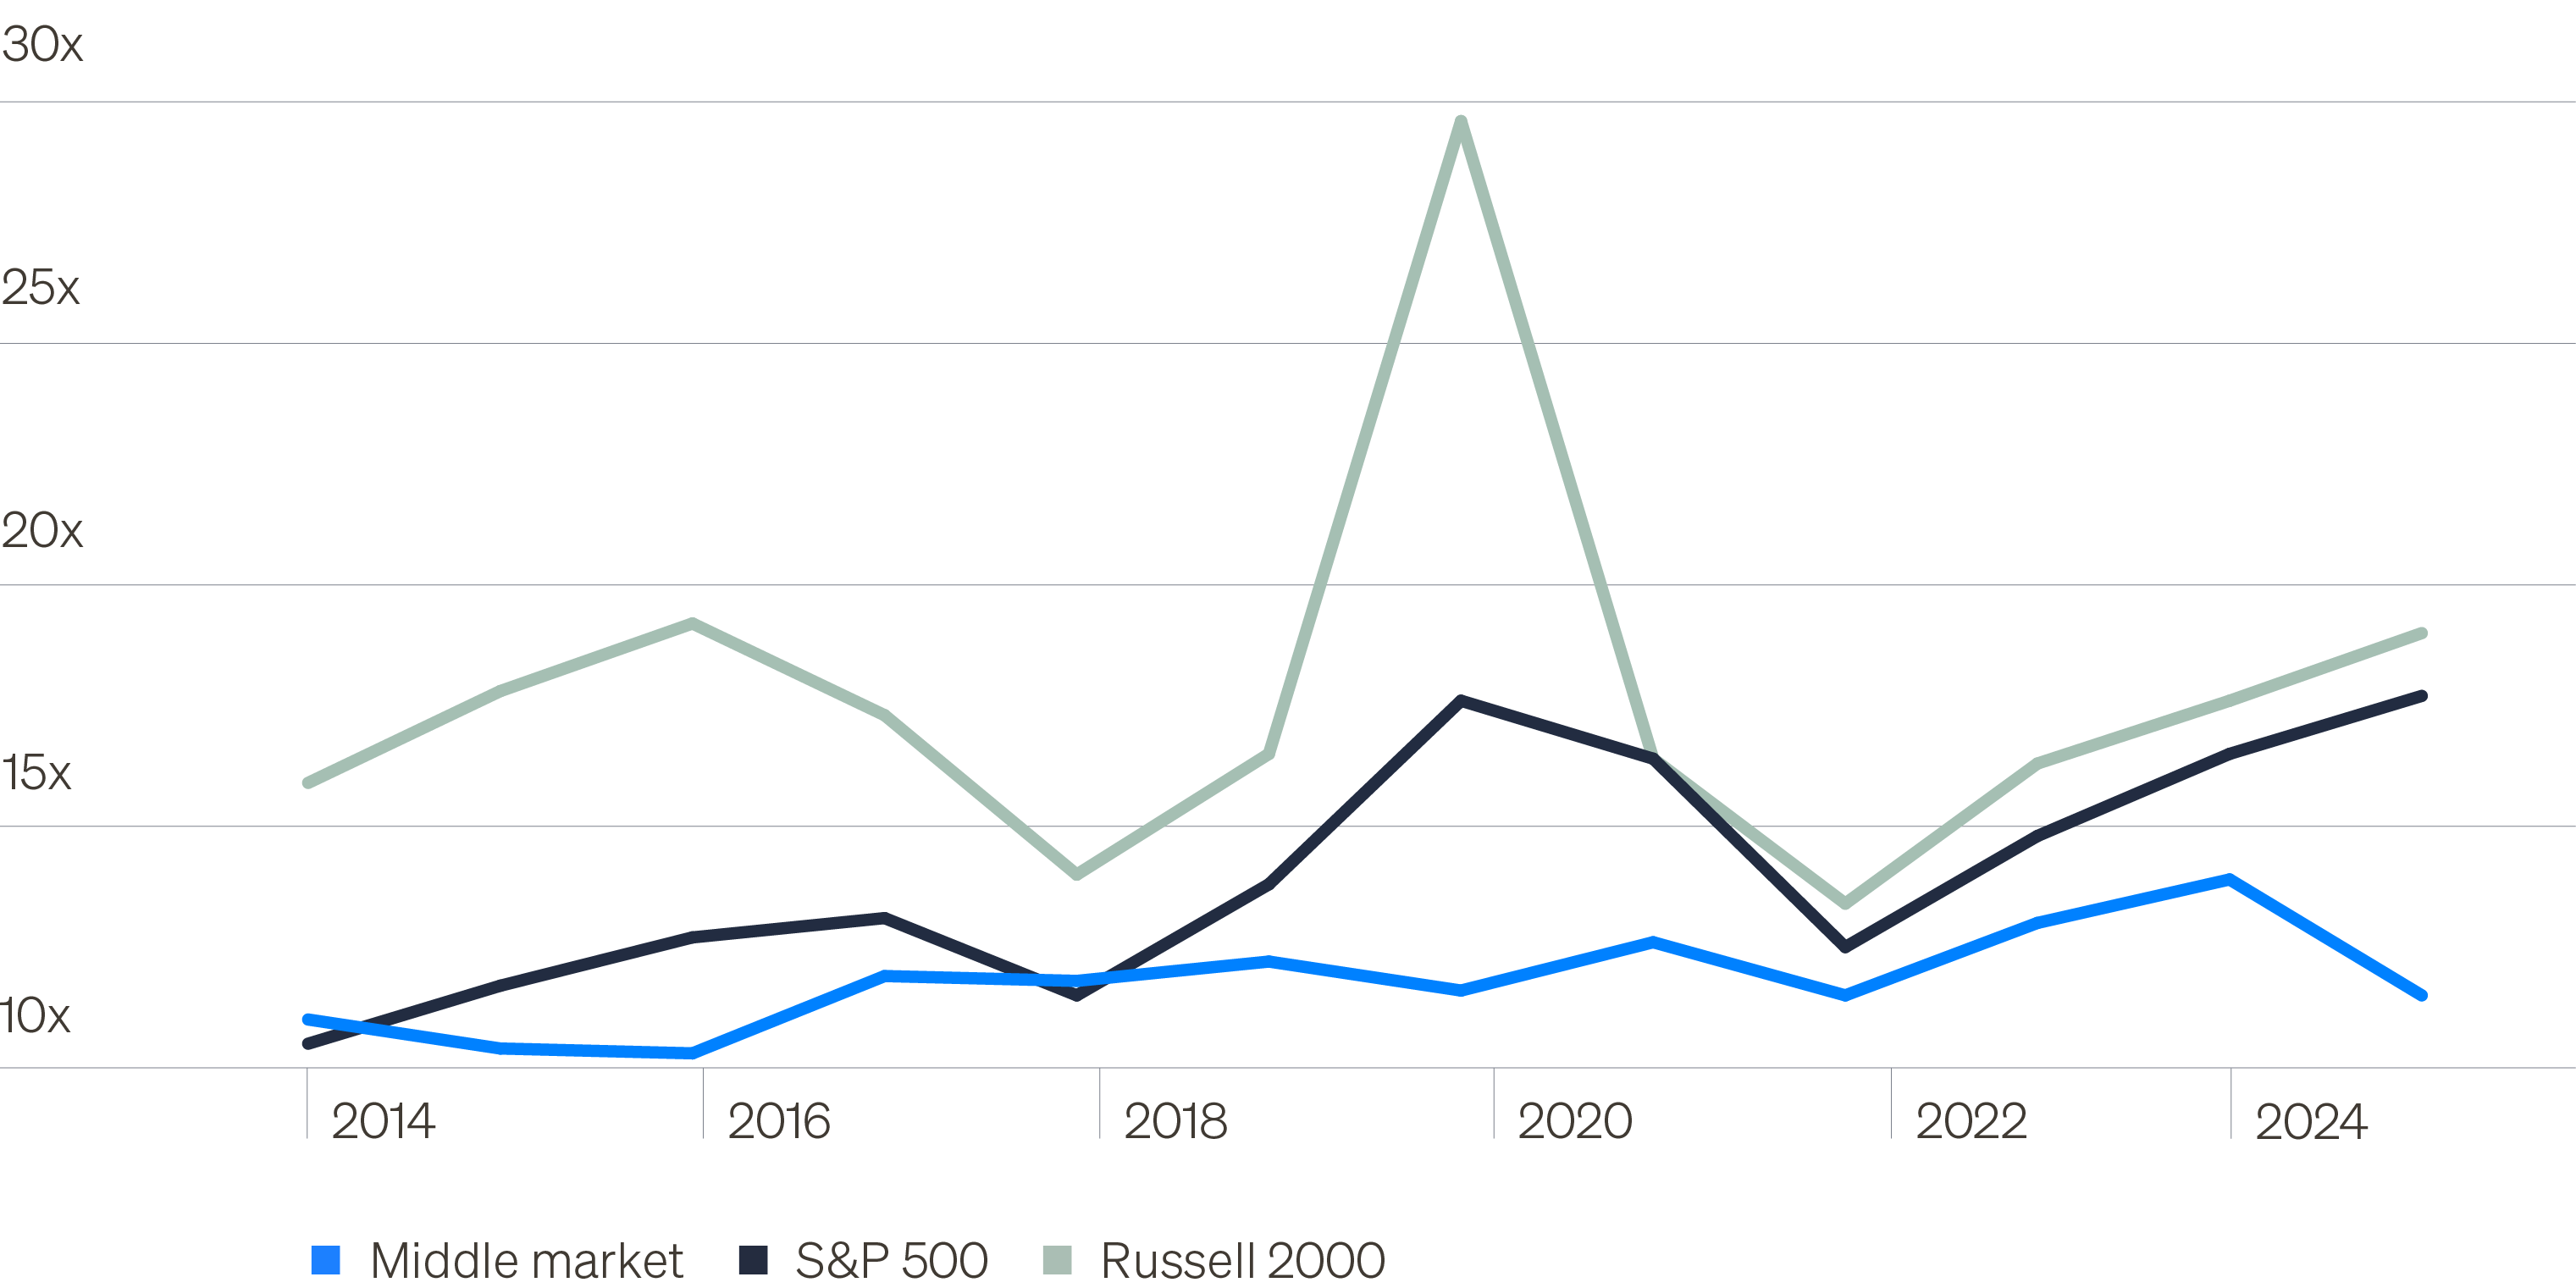
Despite its stronger historical growth profile, the U.S. middle market has traded at materially lower valuation multiples than public equities—averaging a roughly 2.2x discount to the S&P 500 and a 5.7x discount to the Russell 2000 since 2014 (Figure 3).
Figure 3: Enterprise value/earnings
Additionally, the U.S. middle market offers access to a broader, more diversified opportunity set, including sectors often underrepresented in public markets but more reflective of the U.S. economy. As a result, investing in the middle market can help diversify the increasingly concentrated and technology-heavy composition of today’s public equity markets (Figure 4).
Figure 4: Composition of equity markets vs. U.S. private sector
The middle market
private equity advantage
Accessing the middle market
through private equity investing
Since most middle market companies are privately held, private equity funds have served as the primary access point for investors. Though often grouped as a single asset class, private equity spans distinct market segments with meaningfully different market dynamics.
As in public markets where companies are categorized by size (large-, mid- and small-cap), private equity can be viewed through a similar lens, with managers specializing across segments. While definitions may vary, we segment the universe based on company and market structure characteristics that have historically exhibited similar performance and risk dynamics (Figure 5).
Figure 5: The middle market by segment
Middle market fund managers have historically outperformed their large- and mega-cap peers, driven by both manager skill and the favorable characteristics of middle market buyout transactions (Figure 6).
The middle market is highly fragmented, and because companies are typically smaller and earlier in their growth cycle, valuations can vary widely. These dynamics create opportunities to invest in middle market businesses at more attractive prices and terms than large-cap transactions.
Lower purchase prices reduce the need for leverage (borrowings) to finance acquisitions. This is especially important in today’s higher interest rate environment, where returns are more likely to be driven by underlying business performance than financial engineering.
Finally, middle market companies often provide greater flexibility at exit. Given their size, large-cap companies rely heavily on public markets for exits (initial public offering, or IPOs). Middle market businesses, however, are common acquisition targets for larger companies, which creates more paths to exit and realize returns for investors.
Figure 6: Comparison of middle market vs. large cap buyout transactions
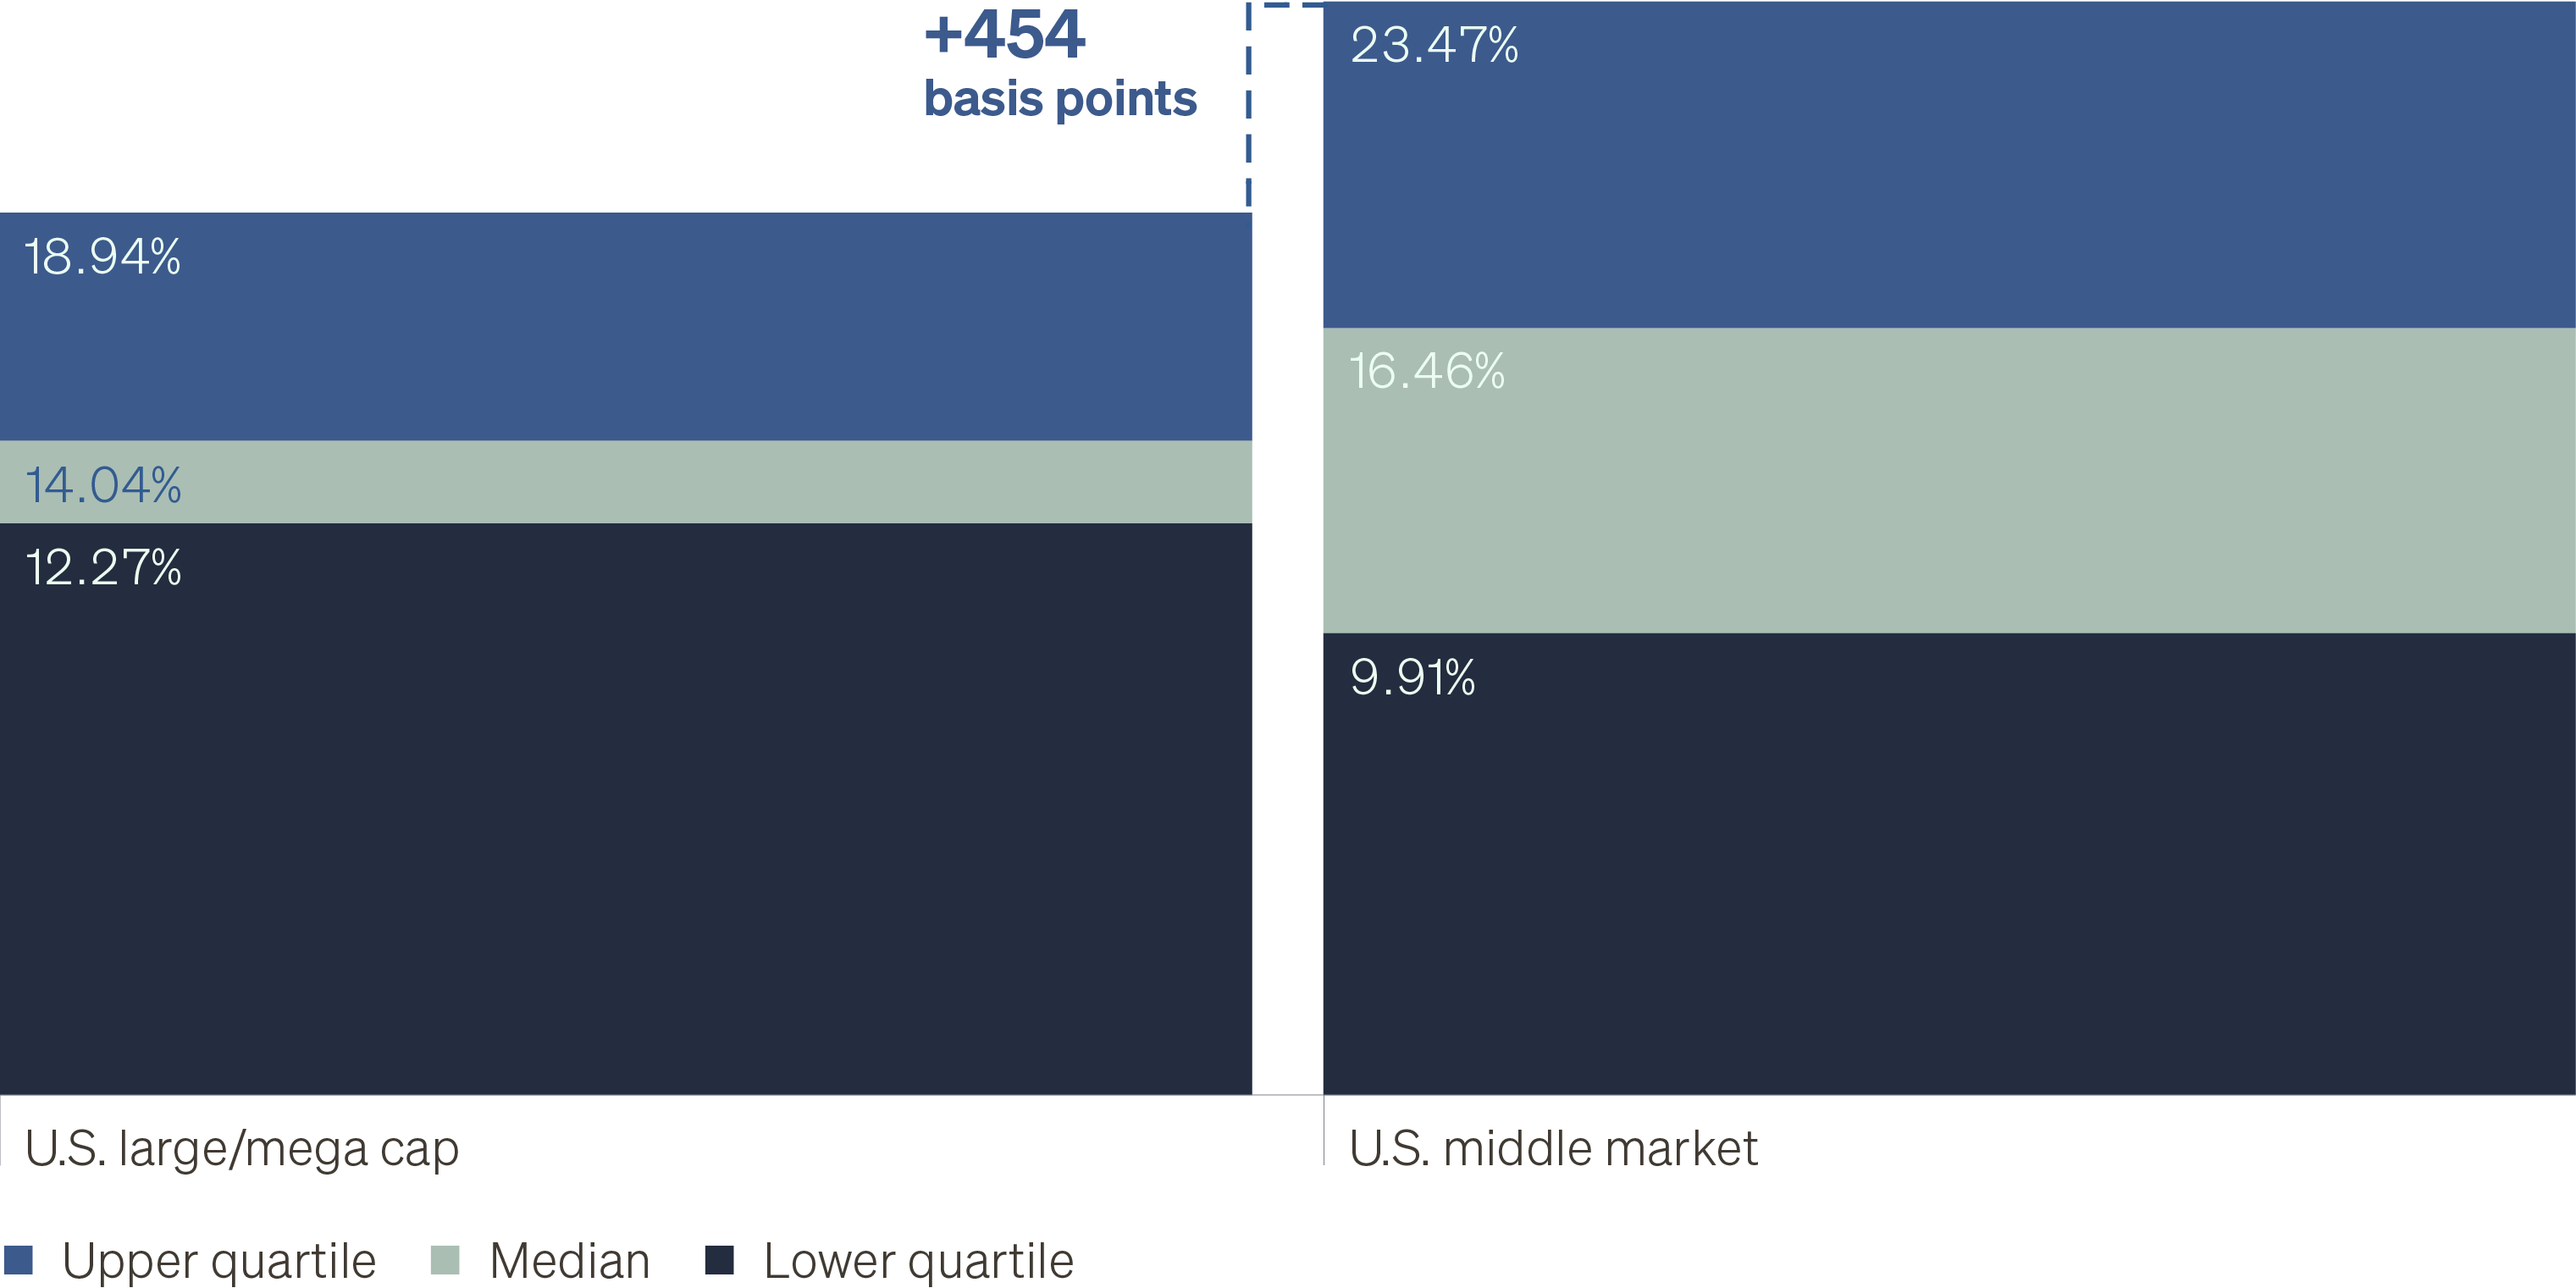
In aggregate, these dynamics have enabled top-quartile middle market buyout funds to outperform top-quartile large cap funds by over 450 basis points (bps) per year among funds with at least 10 years of performance history (the typical full life cycle of a private equity fund). The median outperformance has been approximately 240bps per year (Figure 7).
This highlights an important takeaway: Manager selection and access matter more in the middle market. With a wider range of potential outcomes across funds and vintages, top-tier middle market managers have historically been able to capture a meaningful performance advantage.
Figure 7: U.S. middle market vs. U.S. large/mega cap private equity buyout fund performance
Note: Historical characteristics are not indicative of future results.
Building a durable
private equity allocation
Driving long-term growth through
a multi-strategy approach
Private equity can play an important role in a diversified portfolio by giving investors access to companies and opportunities that are not available in the public markets. Unlike stocks or bonds, which can be bought or sold daily, private equity investments are made over time—often five to 10 years—and returns are generated as companies are acquired, grown and eventually sold.
Therefore, successful private equity investing depends not just on what you invest in, but also when you invest and when your capital is returned.
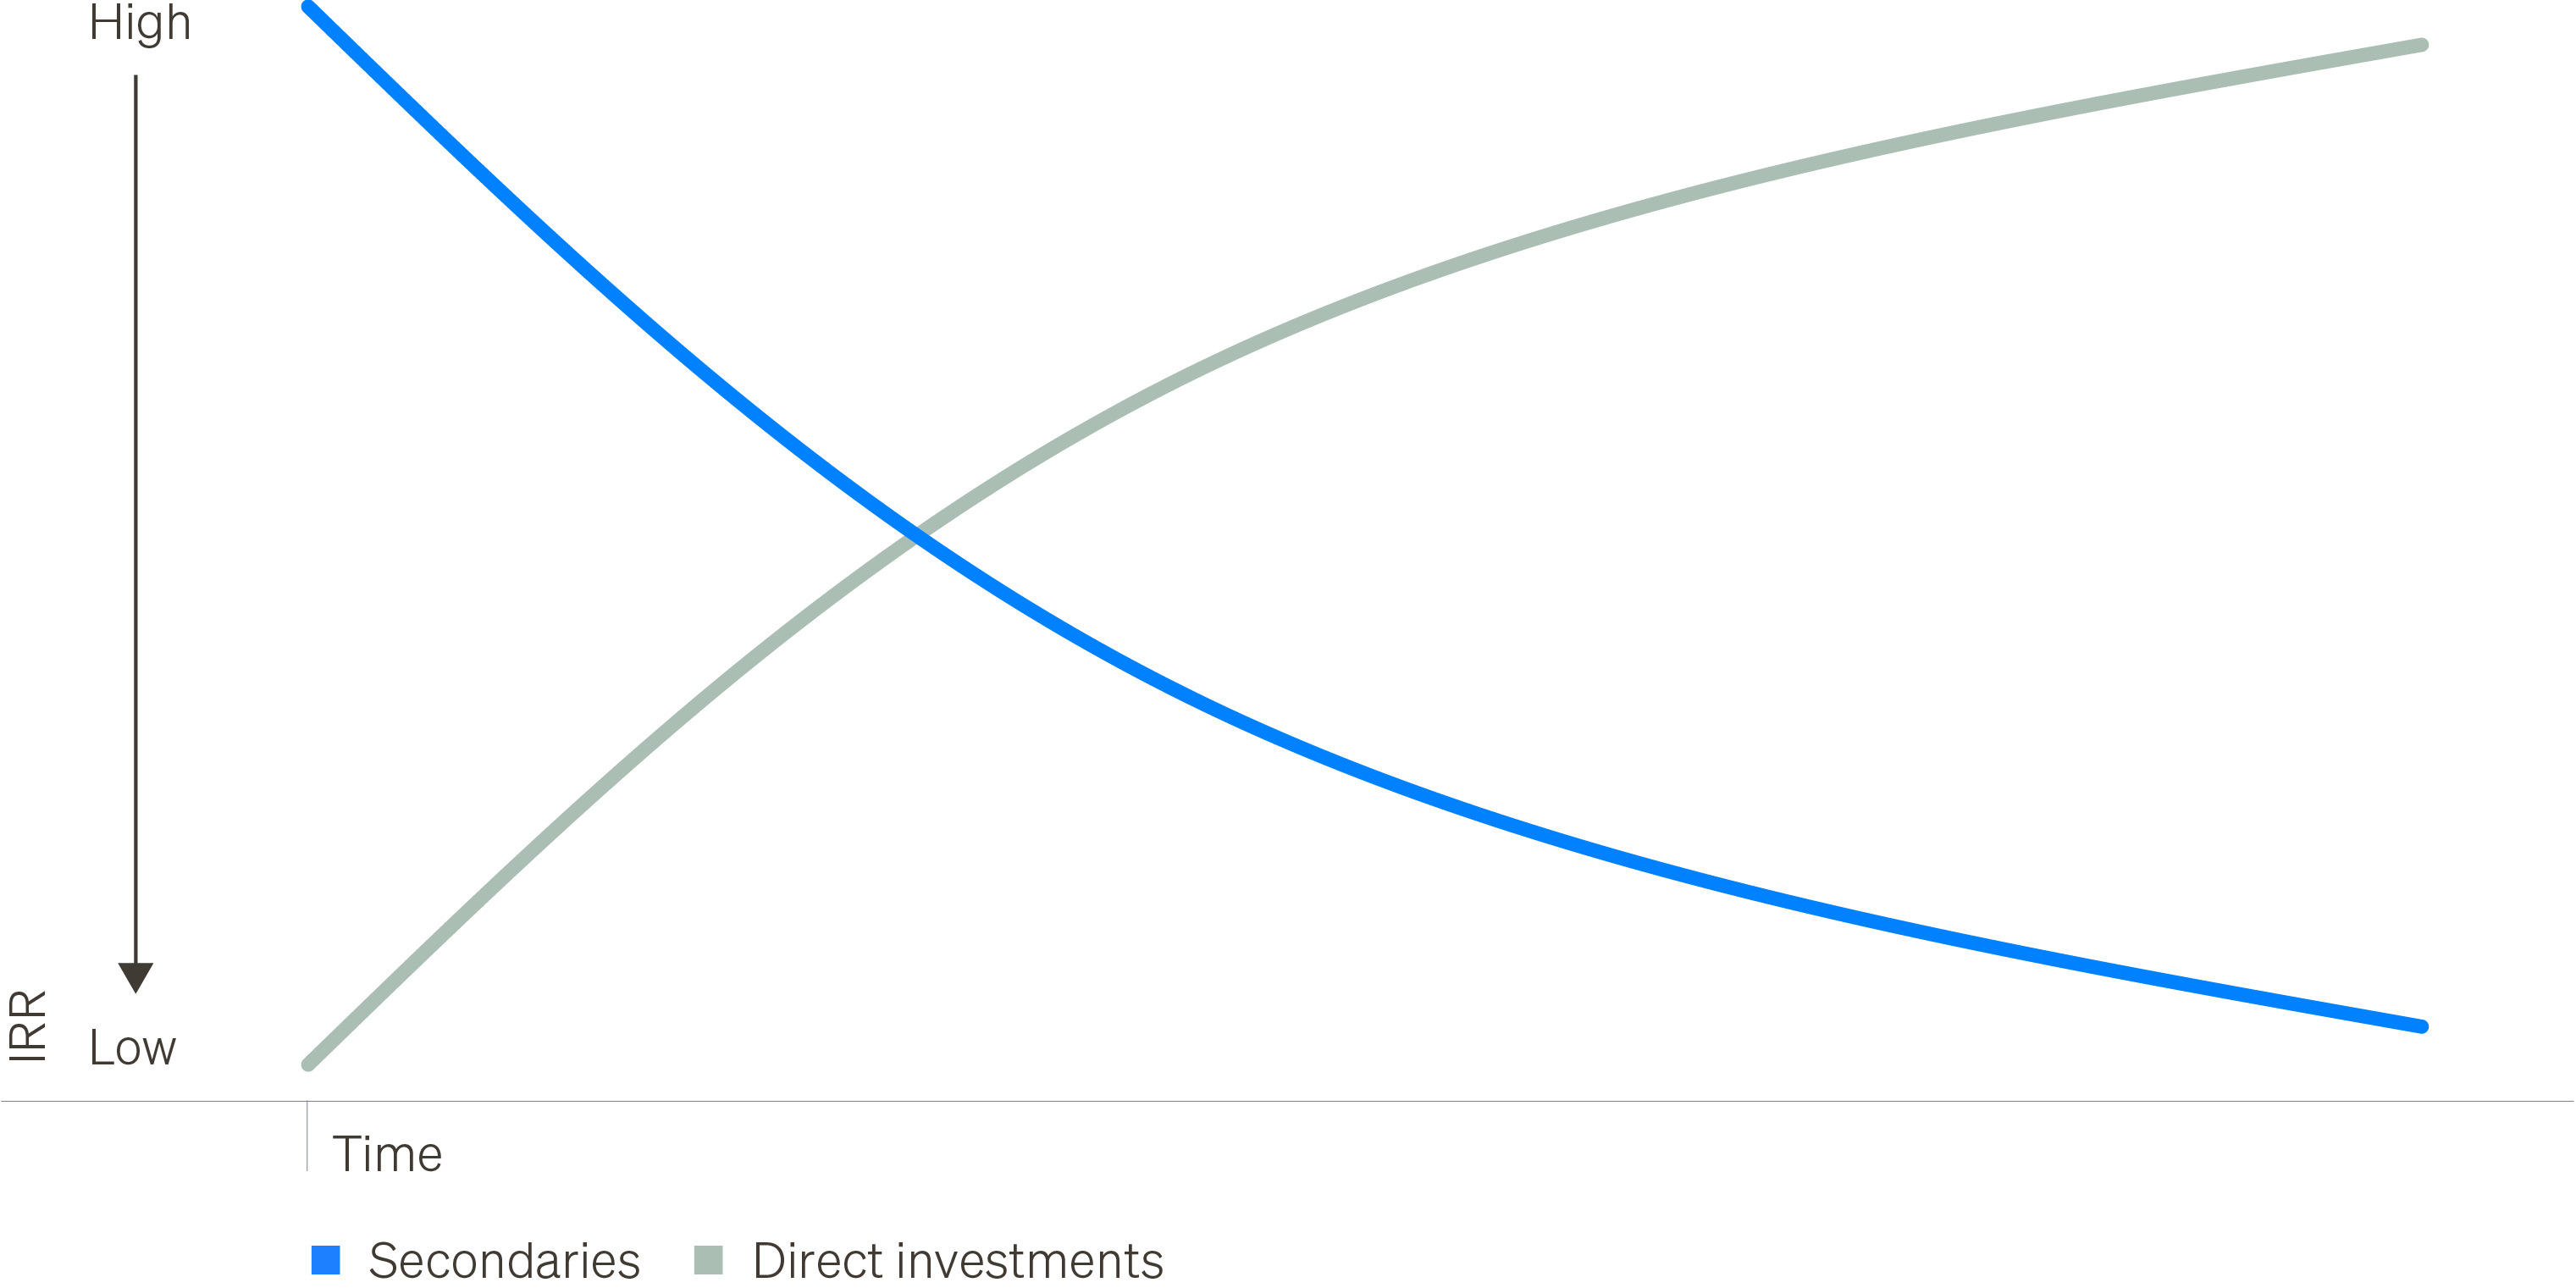
A multi-strategy approach that combines direct investments and secondaries can help address these dynamics (Figure 8). By blending these investments within a single allocation, investors can build more diversified exposure while also creating a more balanced and predictable investment experience over time.
Figure 8: Comparison of direct investments and secondaries
Direct investments refer to investing in individual companies, either independently or alongside experienced private equity managers (known as co-investments) often with lower fees than traditional private equity funds. As a result, they can offer greater return potential. They also provide more direct visibility into a company’s performance over time. However, because these investments are typically made earlier in a company’s life cycle, returns and cash distributions may take longer to be realized as businesses are acquired, grown and ultimately sold.
Secondaries offer a complementary approach. Instead of investing in individual companies, investors purchase stakes in private equity funds from existing investors. These transactions typically occur later in a fund’s life cycle (years 5–8), when portfolios are already built and may include 10–20+ underlying portfolio companies.
As a result, investors can gain exposure to more mature portfolios with the potential for earlier cash distributions than direct investments. Because secondaries are often purchased at a discount to a fund’s reported NAV with the investment valued at NAV at acquisition, investors may realize an immediate unrealized gain at acquisition, which can enhance the return profile of a private equity allocation.
A multi-strategy approach By combining direct investments and secondaries within a single allocation, investors may be able to build a more balanced private equity portfolio with:
- Improved long-term return potential
- More consistent cash flows over time
- Broader diversification across companies and vintages in varying market environments
Figure 9: Hypothetical internal rate of return (IRR) of private equity investments*
Portfolio implementation:
The middle market in modern portfolios
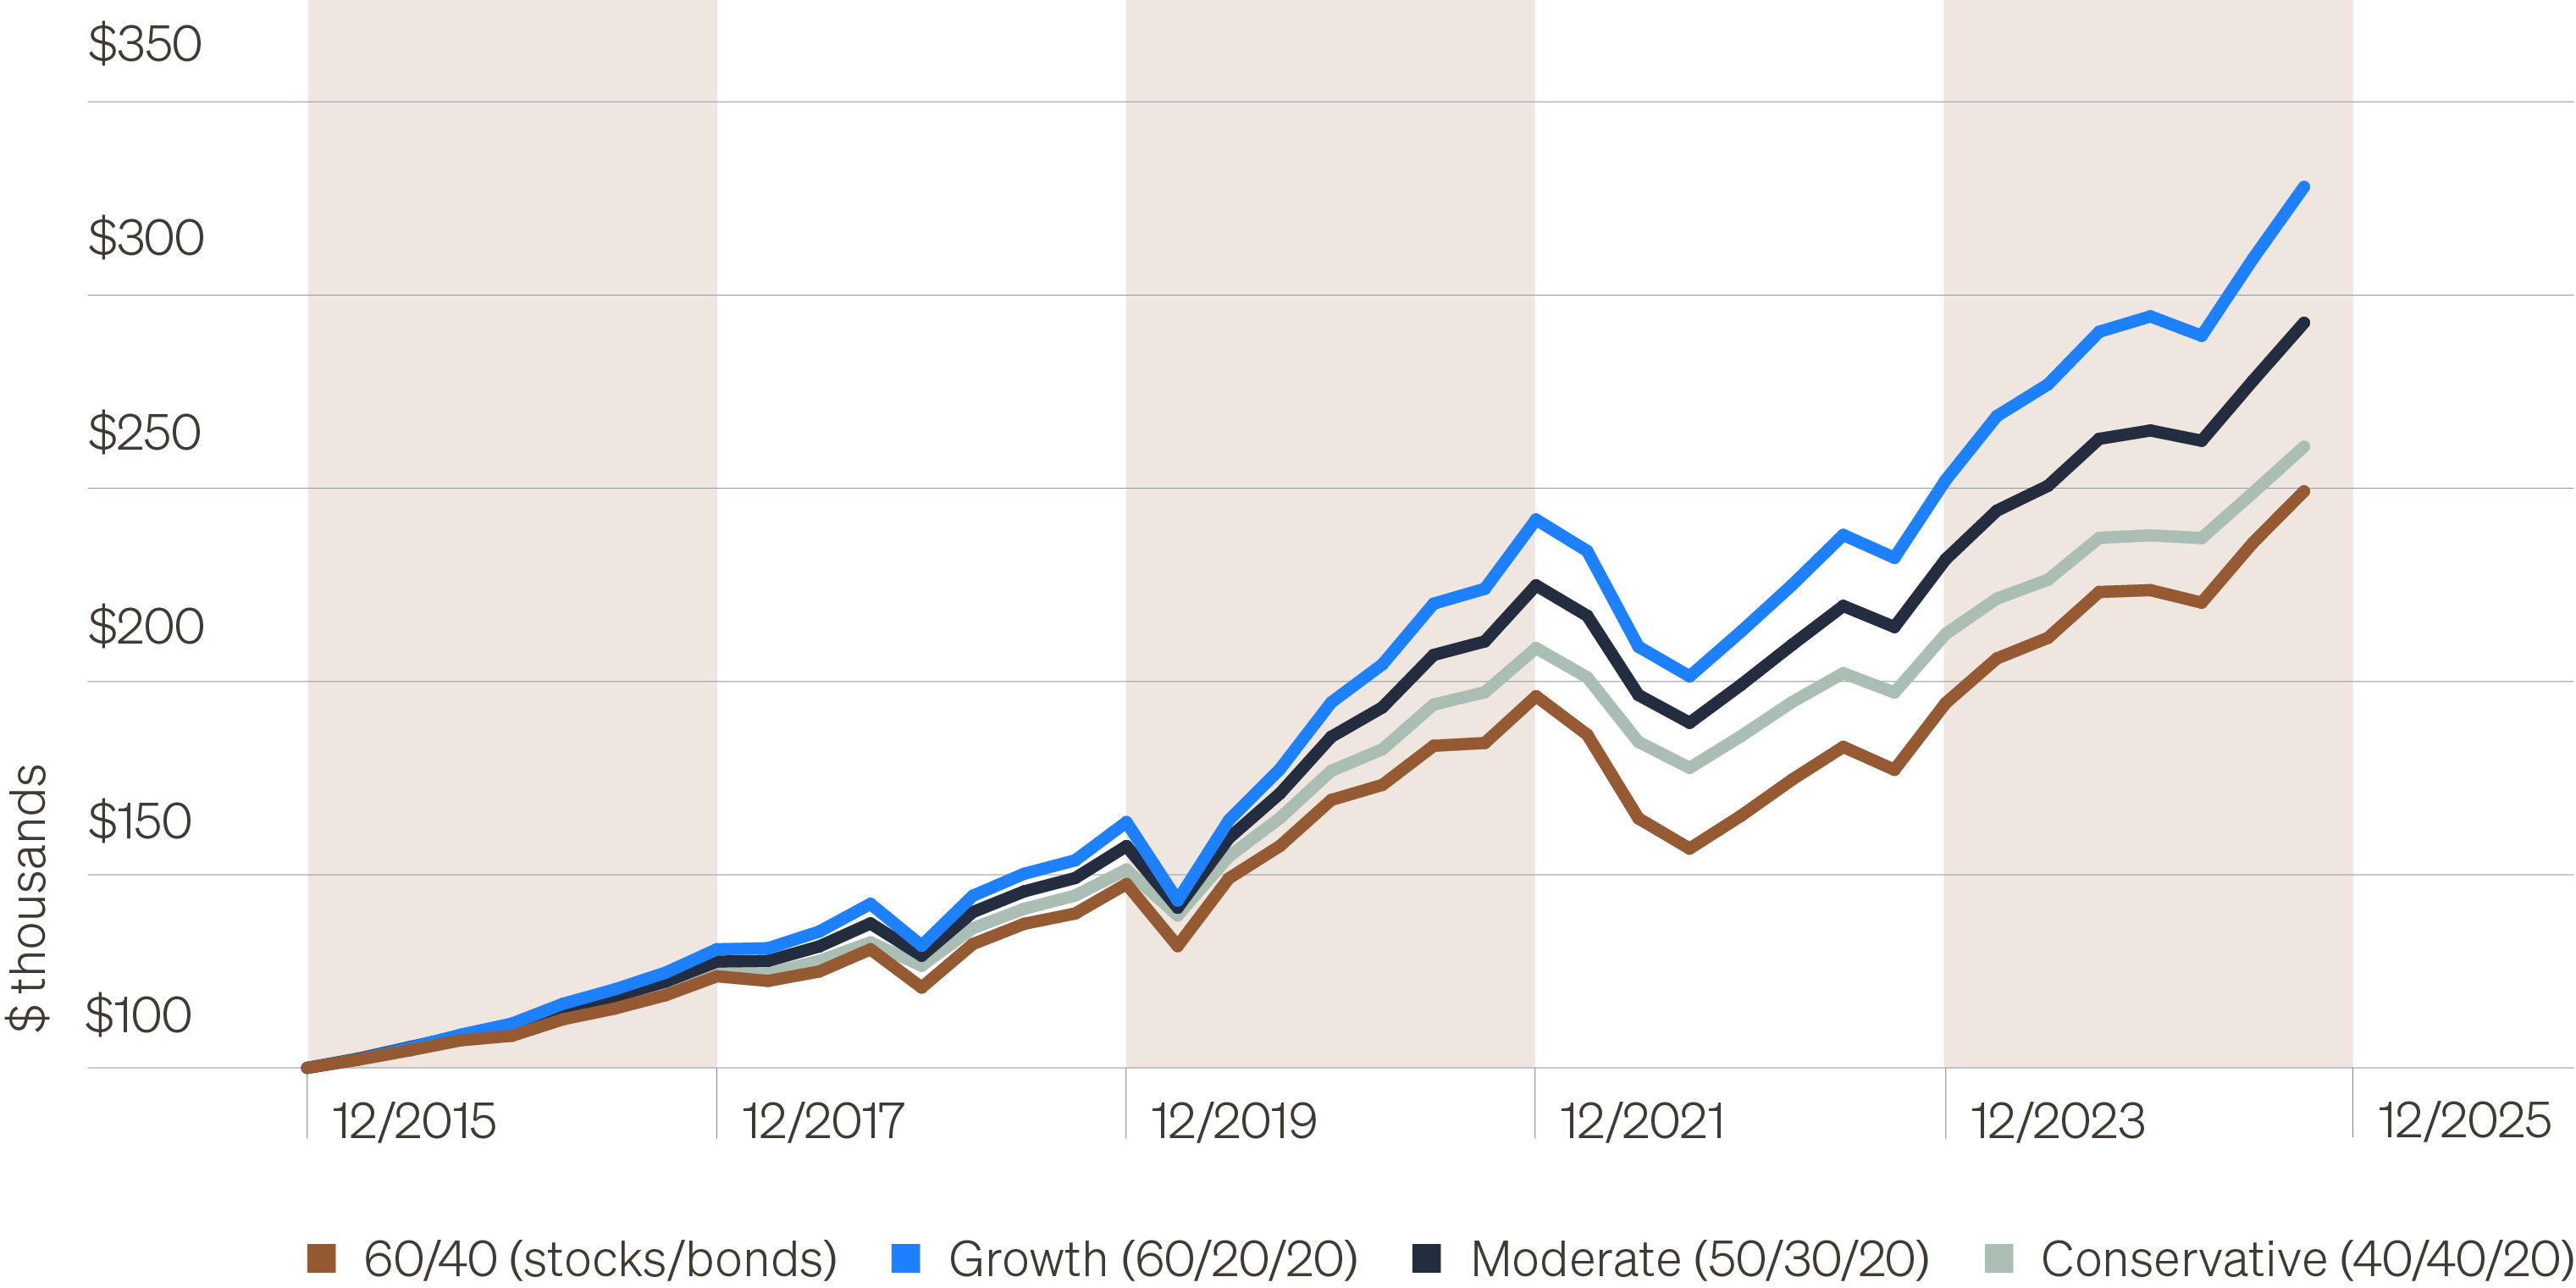
An allocation to middle market private equity over the last 10 years would have enhanced portfolio performance, boosting both absolute and risk-adjusted returns while reducing overall volatility.
In the illustration below, we compare the performance of a traditional 60/40 portfolio to hypothetical portfolios with a 20% allocation to the middle market:
- A moderate portfolio, sourced evenly from stocks and bonds
- A growth portfolio, sourced solely from bonds
- A conservative portfolio, sourced solely from stocks
In aggregate, the results underscore the middle market’s role as a powerful return- enhancing and risk-mitigating complement to traditional portfolios in an environment defined by concentration, valuation risk and diminishing diversification.
Figure 10: Growth of $100,000 over 10 years
Summary
As public markets become more concentrated and represent a smaller share of the economy, we believe investors will need to look beyond traditional allocations. The U.S. middle market provides exposure to diverse, growing companies with compelling valuations and differentiated return drivers. Combining complementary private equity strategies can help access this opportunity in a more balanced, consistent way.