Macro + public markets
Explore Future Standard’s core views on macro and public markets.
- The U.S. economy has slowed in 2025: While there are risks of more substantial economic deterioration, that is not our base case. The economy is bifurcated: On one side sits the housing market, low-end consumers, government spending and anyone searching for a job. On the other side sits wealthy consumers and anything AI-related.
- Rates decline, inflation continues: Short-term U.S. rates are set to decline as the Federal Reserve eases policy. Markets expect the Fed funds rate to fall below 3% by end-2026, but we think inflation data will continue to make monetary policy a meeting-by-meeting proposition. Duration continues to pose two-way risks despite the recent decline in long yields.
- Equities’ leverage to AI trade grows: U.S. equities trail most global markets year to date (YTD) but have improved their relative performance in recent months as the AI trade has surged back to the fore. Valuation and concentration risks have only grown—the equity risk premium sits at the lowest level in 20 years, while the megacap tech firms that comprise an outsized portion of the market are seeing free cash flow hit by surging AI capex.
The economy has fewer engines firing
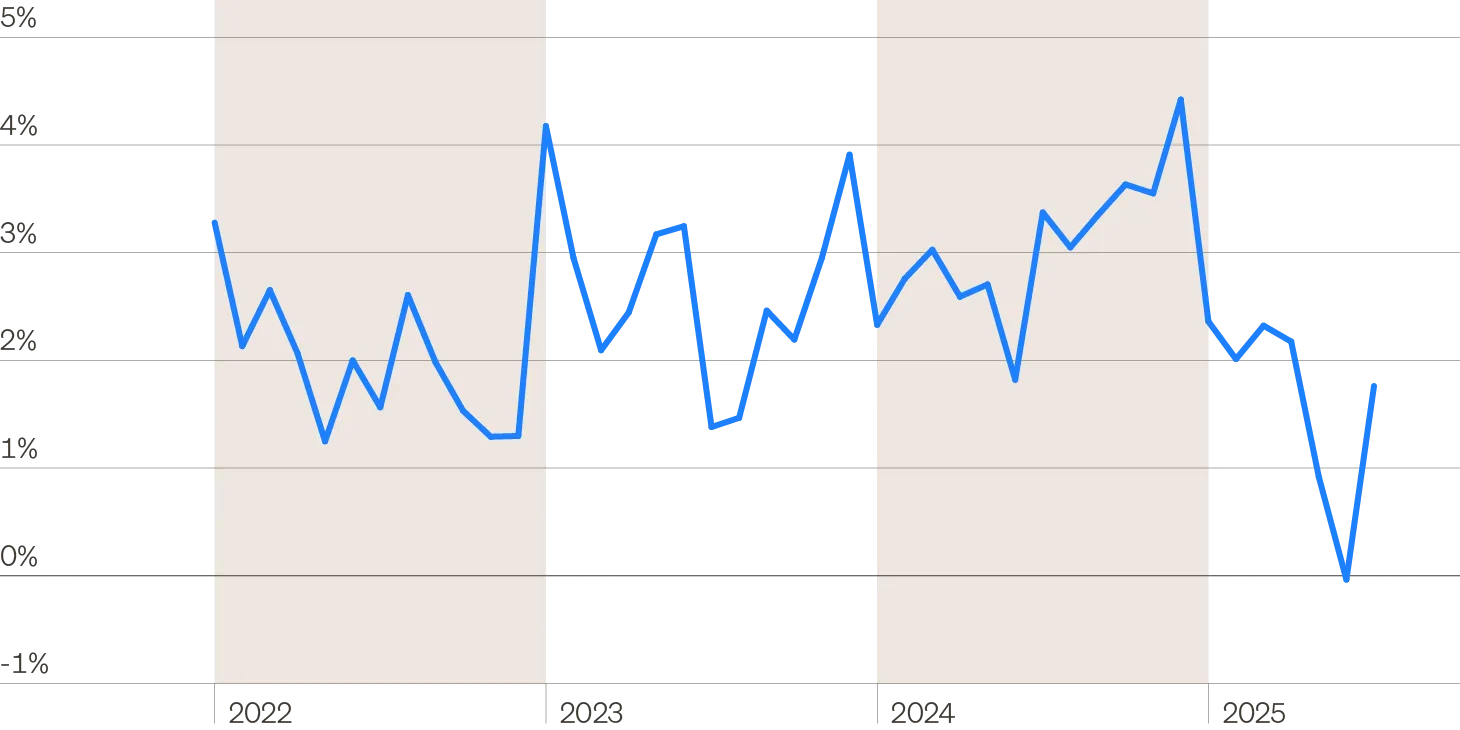
The most important factor is the health of the consumer, which powers 70% of the U.S. economy. Real spending has slowed to an annualized growth rate of 1.75% over the past six months as households turn to caution amid rising inflation and labor market uncertainty.
Real personal consumption growth rate (6-month annualized)
Long-term inflation expectations still contained
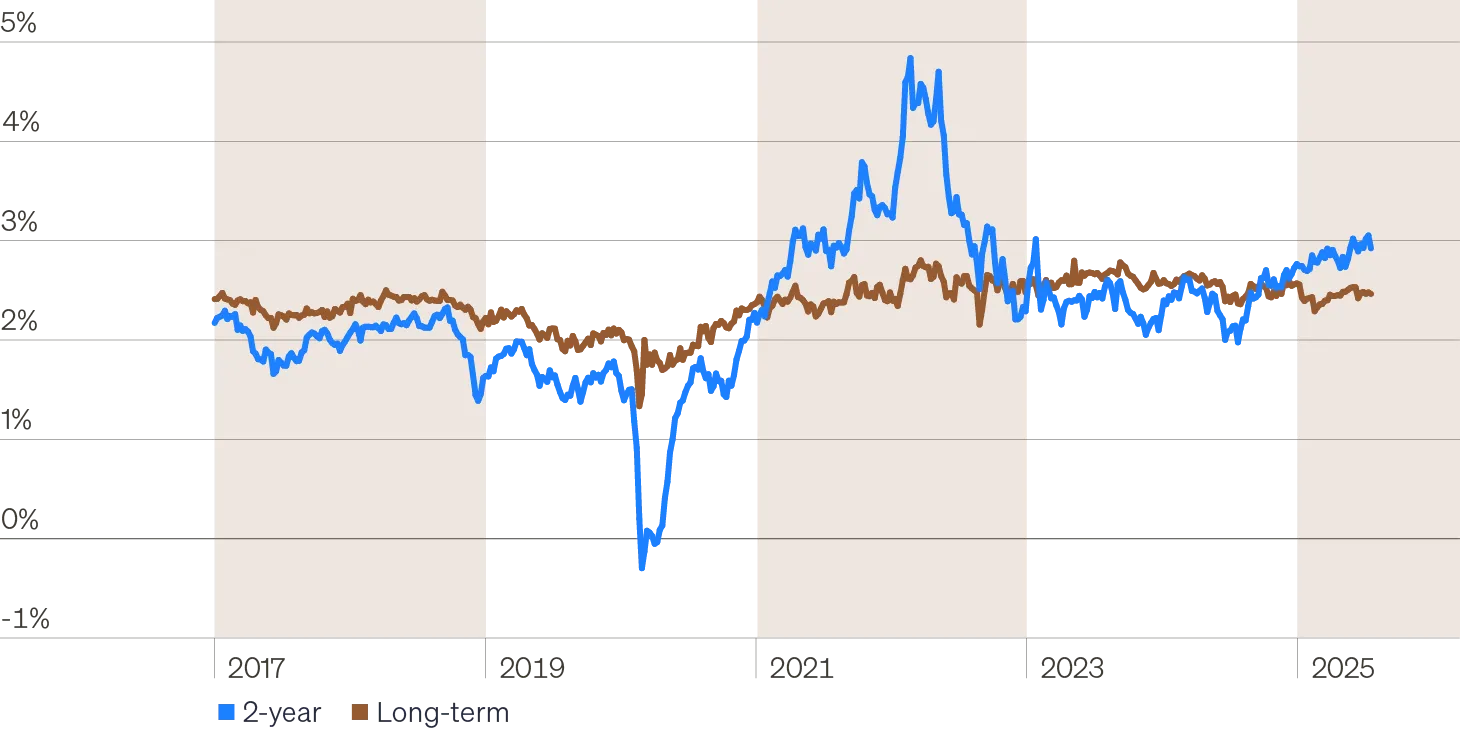
For now, markets do not see a long-term concern. Two-year inflation expectations have risen by 1% over the past year, but long-term expectations remain well-anchored.
Short-term and long-term market inflation expectations
Policy likely to push up short-term inflation
Expected impact of major macro forces over the next 12 months

The U.S. economy is being shaped by the implementation of major new government policy—in the trade, immigration and fiscal realms—as well as the buildout and implementation of artificial intelligence (AI).
How will these forces impact the state of growth and inflation over the next year? Tariffs and immigration policy have acted to slow growth so far. We expect they will push prices higher in the short term via supply-side effects, although tariffs’ impact on inflation in the longer term is more complicated.
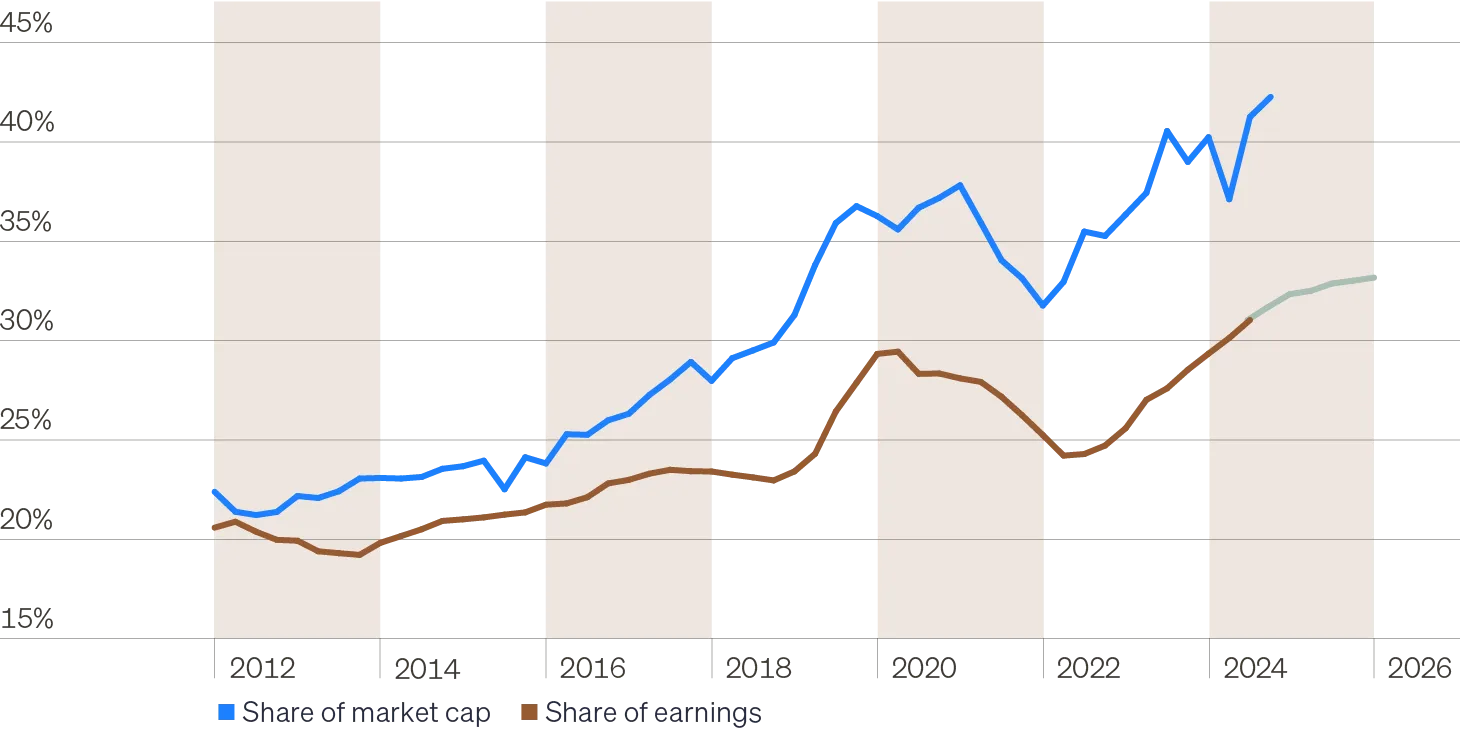
Equities increasingly leverage to the AI trade
The S&P 500 is more reliant than ever on the technology and media sectors, both for performance and fundamentals. Stocks in these sectors now collect roughly one-third of the index’s earnings and comprise more than 40% of its market cap.
European stocks’ strong relative performance early in the year was significant but short-lived. A market without the ability to drive consistent earnings growth—partially a function of its lagging tech sector—will have trouble leading for long.
Tech & media stocks’ share of S&P 500 market cap and earnings
CAPEX is weighing on prodigious free cash flow
The market has thus far been willing to give today’s tech firms the benefit of the doubt due to the incredible profitability of their existing business lines and the promise of AI.
However, investors should be wary as rapidly escalating capex detracts from the cash flow generation that has become the calling card of today’s tech giants. With rising costs and still-uncertain payoffs from AI, the risk to a concentrated equity market may be significant.
Changes to 2026 estimates for U.S. hyperscalers ($ billions)

Get the latest on the macro economy, rates/fixed income, equities and public credit.
Private markets
Explore Future Standard’s core views on private markets across private equity, private credit and real estate.
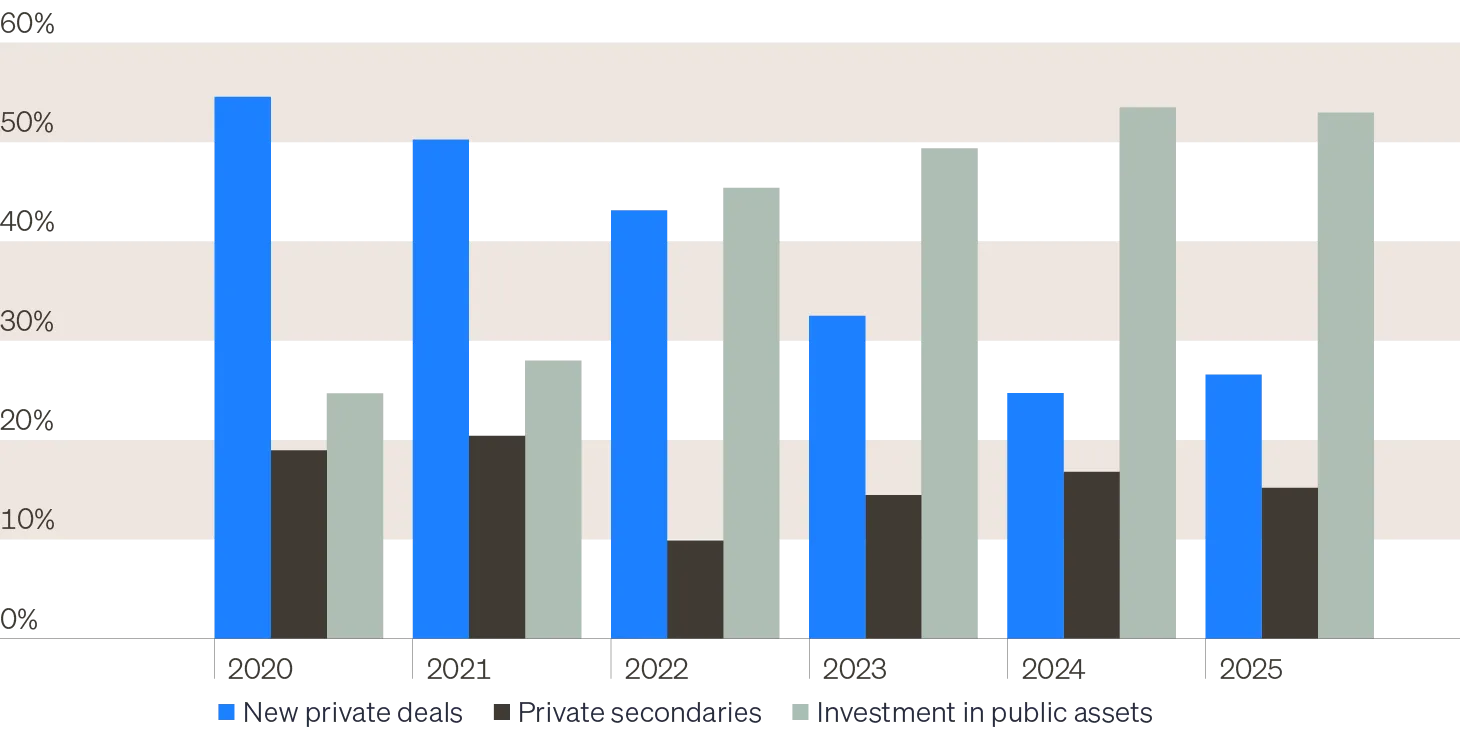
- Private equity: The recovery in deal activity remains in the early innings but appears to be underway. After a multiyear delay spanning 2022 and 2023, just as momentum appeared to be coalescing, Liberation Day provided deal-makers an unwelcome surprise that is only recently wearing off.
- Private credit: Credit losses remain contained, producing annualized returns in excess of 10%, levels attractive versus historical equity performance and current valuations. Competition with the broadly syndicated loan (BSL) market has tightened spreads at the upper end of the market, increasing the value of diversification and specialization.
- Real estate: Real estate has historically been a market dictated by income generation. The 2010s were a departure from that norm, as record-low interest rates allowed cap rates to fall and boost values. But with higher rates having disciplined the market, we expect yield and income growth to return as the dominant determinant of returns.
Large cap PE turns to public market
Private equity’s value proposition for investors is threefold: Higher growth through operational improvement, diversification through market completion and cheaper purchase prices to compensate for illiquidity.
Large general partners (GPs) are now buying established public companies—targets that contrast with private equity’s value proposition of driving change and creating growth, rather than simply owning scale.
Global private equity deal composition, share by acquisition target (%)
Smaller private firms consistently outperform
Public equity investors seeking diversification in small- and mid-cap stocks have been frustrated by persistent underperformance versus large-cap growth. The size premium has proven elusive, with lower quality and cyclicality limiting its usefulness in portfolios.
The size premium is alive and well within the U.S. middle market, as shown by small and midsize buyouts. Outperformance has been driven by smaller firms’ ability to improve operating results more rapidly, a trait that has been consistently absent in smaller public companies.
Private equity total returns by strategy
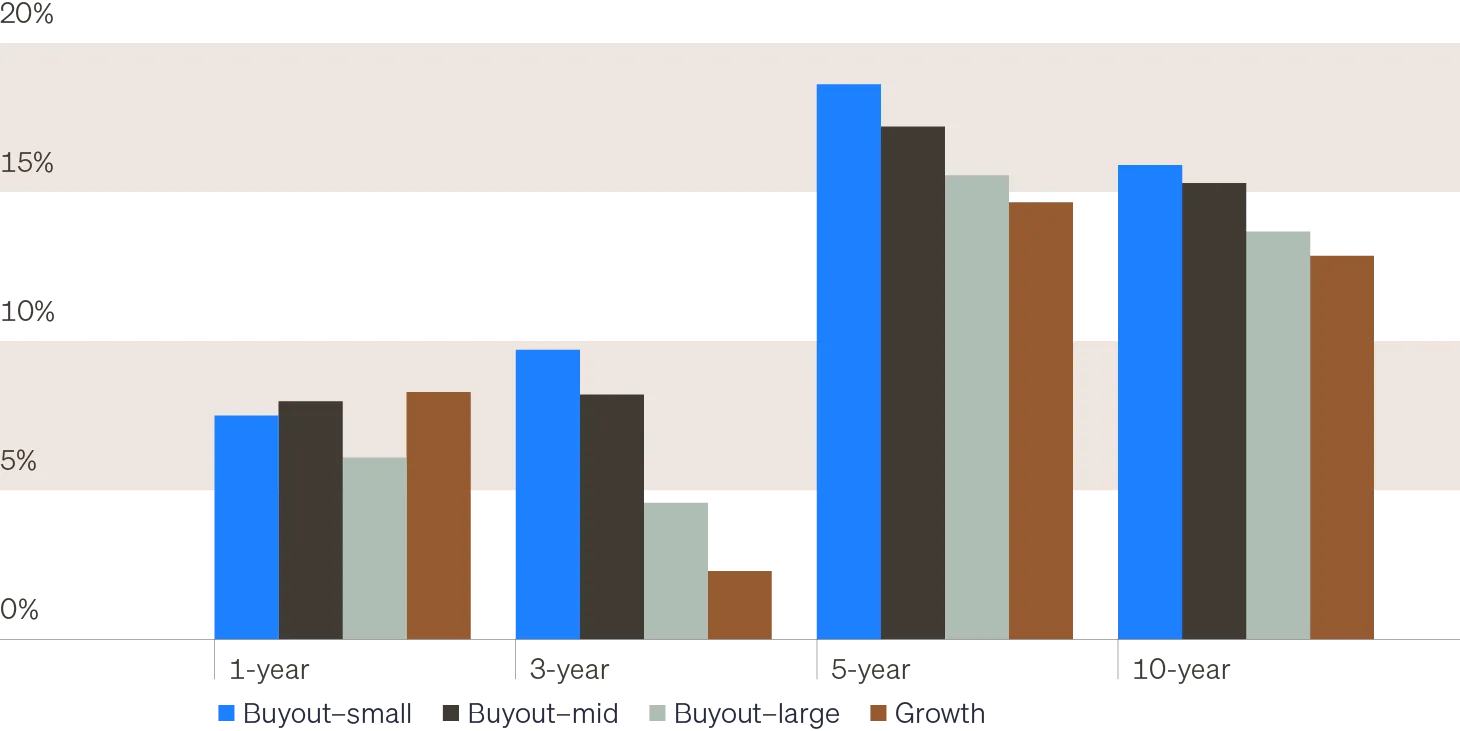
Vintage 1992-1996: Small buyout ≤$200M; Mid-sized buyout $200-500M; Large buyout >$500M.
Vintage 1997-2004: Small buyout ≤$300M; Mid-sized buyout $300-750M; Large buyout $751M-2B.
Vintage 2005-present: Small buyout ≤$500M; Mid-sized buyout $500M-1.5B; Large buyout $1.5-4.5B.
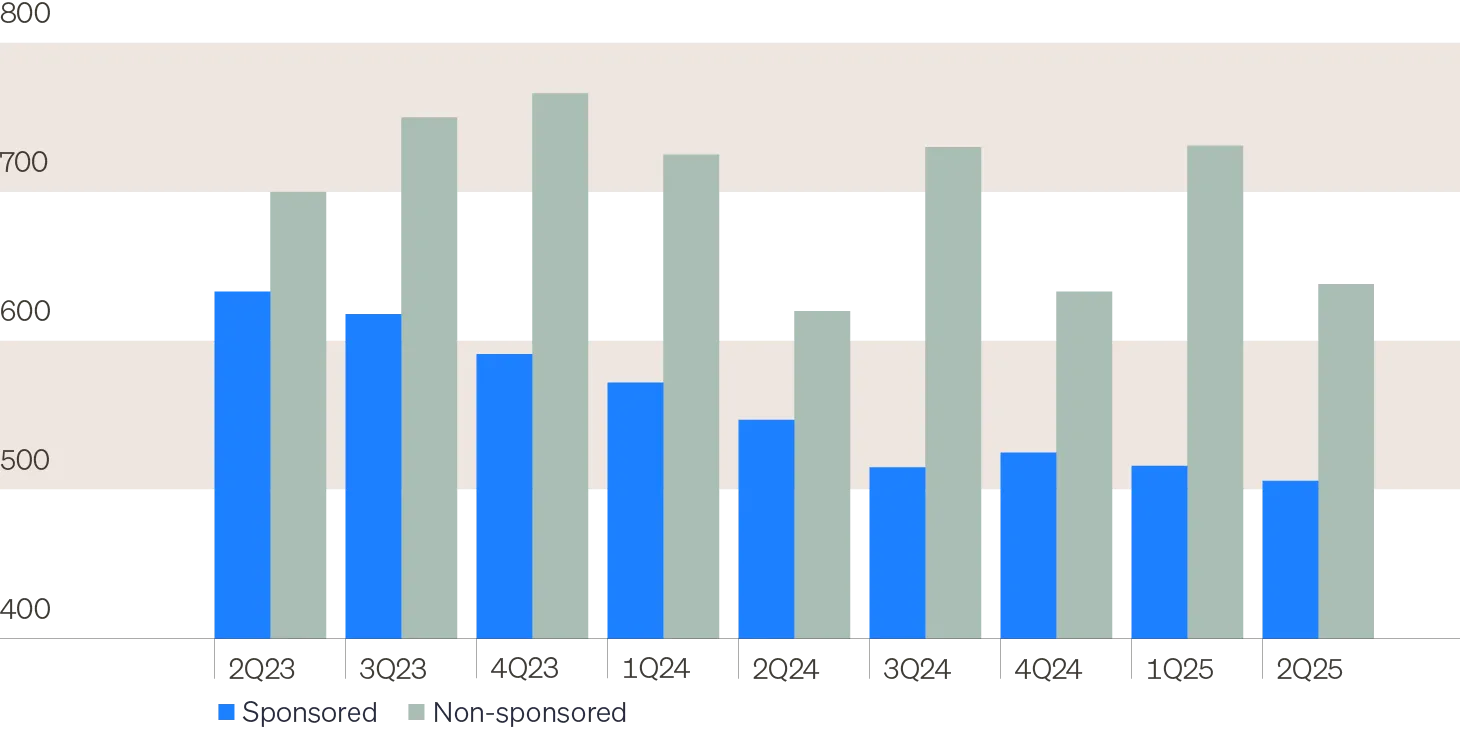
Competition with the BSL underscores the need for diversification and specialization
While upper middle market and large-cap direct lending deserve to continue featuring prominently in portfolios, the trends mentioned earlier call for greater diversification within a private credit allocation.
With sponsor-backed borrowers driving BSL competition, borrowers without private equity backing occupy a different segment of the market with unique drivers. To that end, the contrasting change in sponsored vs. non-sponsored spreads is apparent—sponsored spreads have marched sequentially lower, while non-sponsored spreads appear undefined by the trend.
Quarterly first lien spreads by loan types (basis points)
Real estate is an income-centric market again
The commercial real estate market’s extended correction ended in the second half of 2024, as property values have stabilized and transaction activity has begun to rebound, albeit slowly.
Performance for the NCREIF ODCE Index—a benchmark for institutional core U.S. real estate—has been positive four consecutive quarters.
NCREIF ODCE index quarterly return attribution

Get the complete analysis on private markets across private equity, private credit and real estate.
Portfolio construction
Explore Future Standard’s core views in alternatives allocation.
- Stock-bond correlation: Stock-bond correlation is 0.55 over the past three years. With inflation persistently elevated and global shocks more common, it is highly likely to remain positive for the foreseeable future.
- More than just exposure: Over the past 20 years, allocating to private markets was transformative for portfolios. The criticality of alternatives for portfolios will only grow over the next two decades, but as the space matures, investors will likely need more than simply broad exposure.
- Solutions for public equity risks: Middle market private equity offers potential solutions for the major risks facing public equity portfolios—namely, high valuations and tech concentration.
- Higher rates and private credit: A higher-yielding world opens up new portfolio applications for private credit. Excess yield allows investors to drive the same level of income with less principal, freeing up capital for other uses. In addition, yields in credit are highly competitive with expected returns in the equity market.
- AI diversification: The artificial intelligence theme has become so significant, investors should consider ways to ensure diversification between AI builders and AI users.
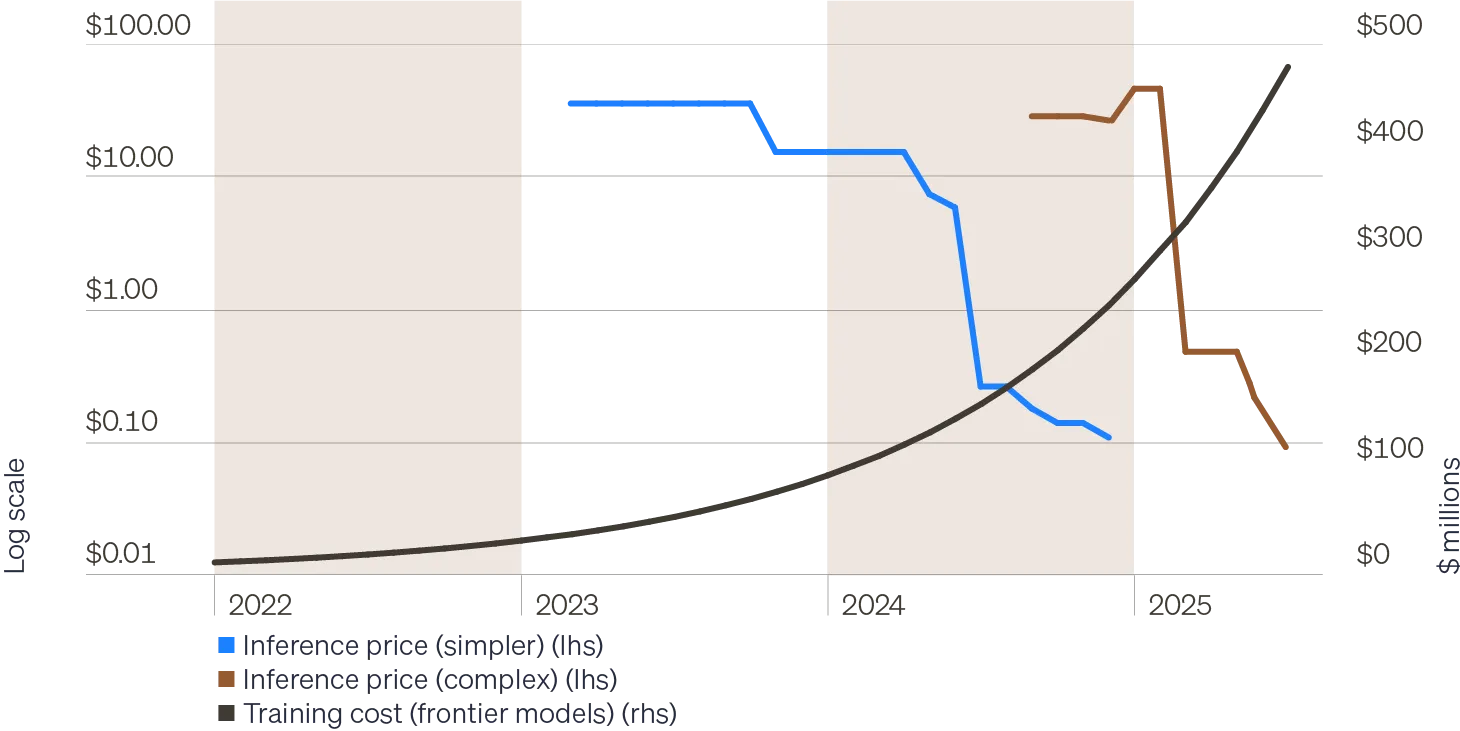
What AI costs mean for investors
The cost of building AI is surging, while the cost to use AI is plunging. We believe investors have too much exposure to the companies engaged in an arms race to build AI, and too little exposure to the firms who will benefit from cheaper productivity gains in the coming years. Some of these firms will come from the tech sector, but many will not.
Generative AI: Cost of model training vs. inference
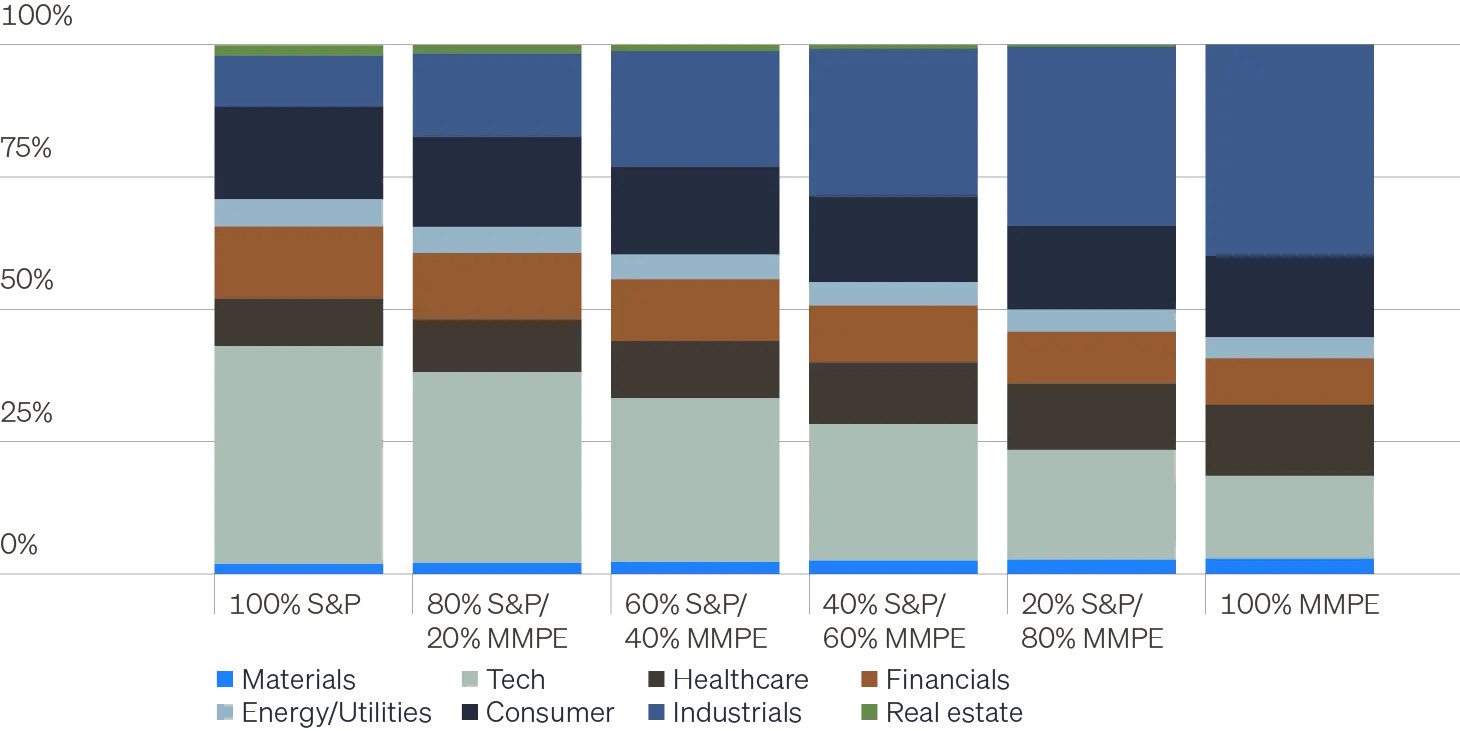
Middle market PE can diversify tech exposure
Middle market private equity offers a very different sectoral makeup, skewing away from tech and toward industrials/business services. As the chart below shows, combining the two can result in an equity portfolio less reliant on tech but still positioned to benefit from further AI-led gains.
Sector composition of hypothetical public/private equity portfolios
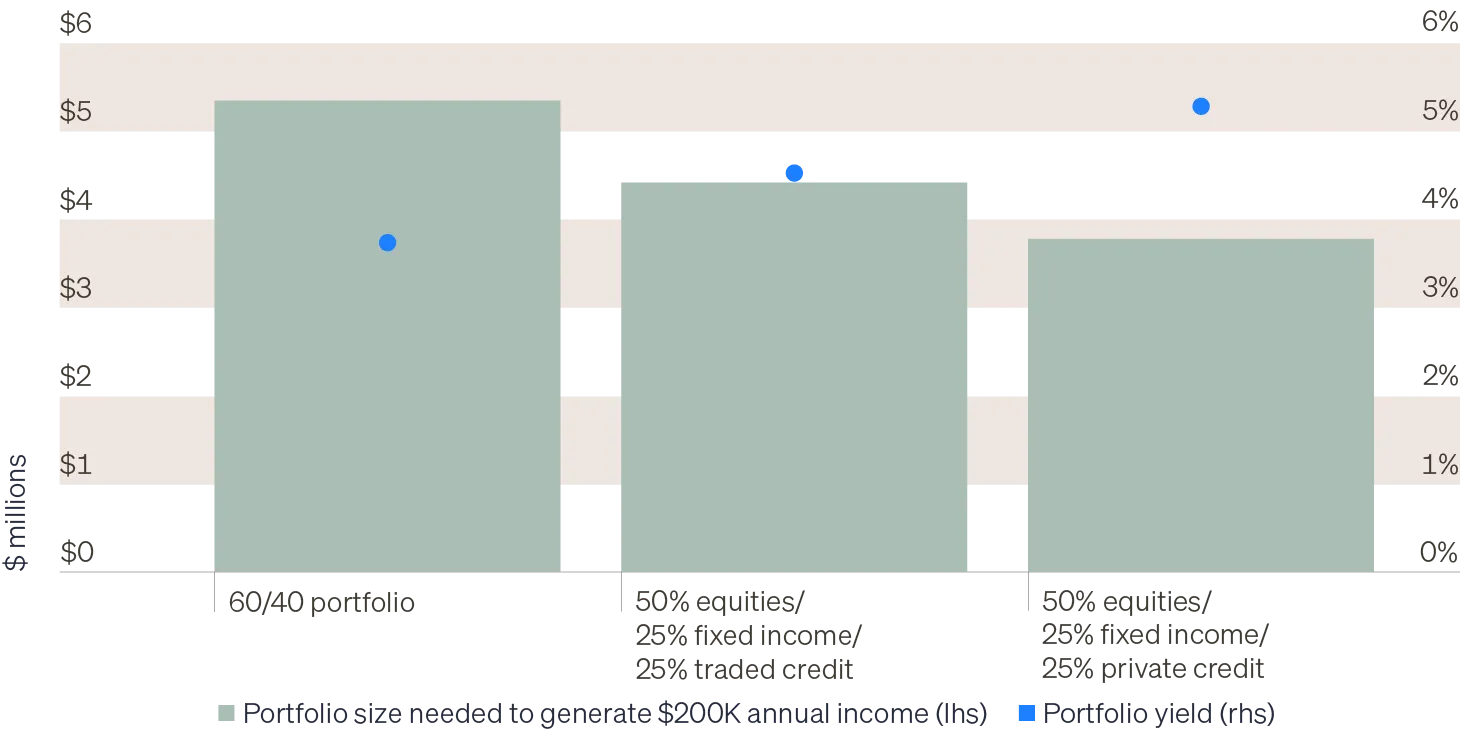
Private credit can drive more income for the money
Private credit can help maximize income generation for a given portfolio size. Currently, one would need more than $5 million in a traditional 60/40 portfolio to generate $200,000 in annual pretax income. Adding a 25% traded credit allocation would reduce that to $4.4 million.
Yield profiles of various hypothetical portfolios
Inflation is a key driver of stock/bond correlation
Stocks and bonds have reliably diversified each other only when the rate of inflation is anchored at 2% or lower, as the left-hand chart shows. When inflation is above 2%—and the central bank must attend to each side of its dual mandate—that diversification breaks down.
CPI vs. stock/bond correlation, discrete 5-year periods